

Outlook for Week 30/2023
"The stock market is a symphony; harmony comes from wise portfolio composition."

As I’ve said before, I will transition to a PDF-based format soon. Key content like the summary table will still be included the way it is now but almost everything else will be put into PDFs to give the newsletter more structure and make it easier for everybody to find what they are looking for without having to through all the material.
Right now, I’m still putting all the content into the newsletter as usual plus the PDFs. That makes it feel even “heavier” than usual. Also, I have included Meeting Preps for the three central banks next week, and two new reports: one with updated intraday seasonalities and another one with Commitment of Traders data. These are things I look at regularly but have just recently put into a format that can be published. If you have any feedback on them, don’t hesitate to reach out!
Welcome to issue #65 of fx:macro!
This newsletter is quite long, so there's a Summary section at the top. Everything you find there is derived from data and news I show in detail in the second and third parts of the newsletter (Week in Review and Market Analysis). I encourage you to go through those parts because they are basically the reasoning behind the conclusions I present in the Summary. If you're short on time or just don't like long newsletters then just skip them.
If you're using Gmail, you will need to click “View entire message” at the bottom since it can't display the whole thing.
The cover image is AI-generated via Midjourney. If you want to guess the prompt, I put it at the end of the newsletter. The quote above comes from ChatGPT (but was curated by me).
If you like this newsletter, please consider subscribing and sharing it or forwarding it to others who might be interested. I'm also on Twitter @fxmacroguy if you want to reach out.

Table of Contents
Summary (Playbook, Calendar, Levels, FX Drivers, Downloads)
Week in Review: a) Central Banks, b) Economic Data
Market Analysis: a) Growth and Inflation, b) Yields, c) Central Banks and the US Dollar, d) Sectors and Flows, e) Sentiment and Positioning, f) Market Risks, g) Various
Top 3 Macro Charts of the Week
Summary
Playbook for next week
This is the shortest possible summary of everything you will find in the rest of this newsletter.
Please check out this article about what this summary aims to provide and what its limitations are.


Economic Calendar for next week
If you want a quick and easy way to hook a customized economic calendar into your favourite calendar app then check out this link.

Important levels to watch and look out for in FX futures

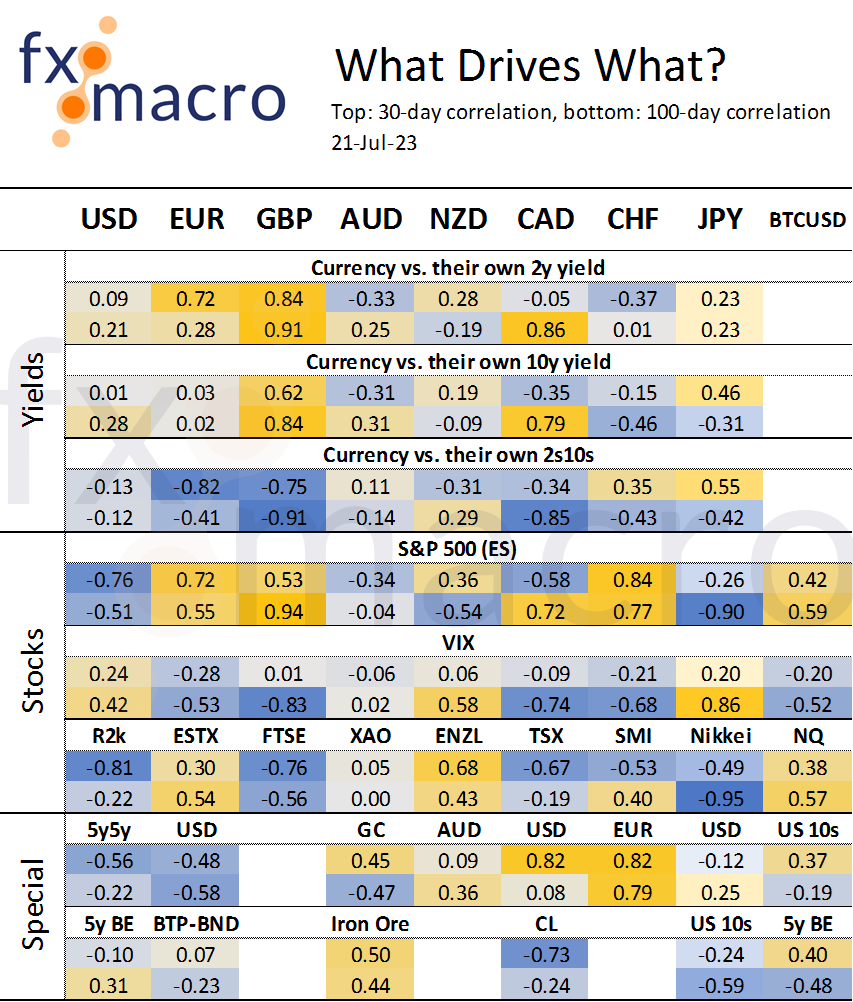
Currency Drivers
For an explanation check out this link.

Downloads and Links
Difftext of the Summary from last week: diffchecker.com
Cental bank overview with the summaries of each of the latest rate decisions, rate statements and minutes:
Central bank speaker recap for the week:
FOMC, ECB and BOJ meeting preps with summaries of the last rate statements, press conference and minutes, relevant economic data and market reactions since then, and a summary of all recent central bank speakers’ comments:
Intraday Seasonalities for currencies and major asset classes:
Commitment of Traders. This is a new report with COT data (legacy, disaggregated, TFF) for relevant futures. Let me know if you have any suggestions:
Week in Review
Central Banks
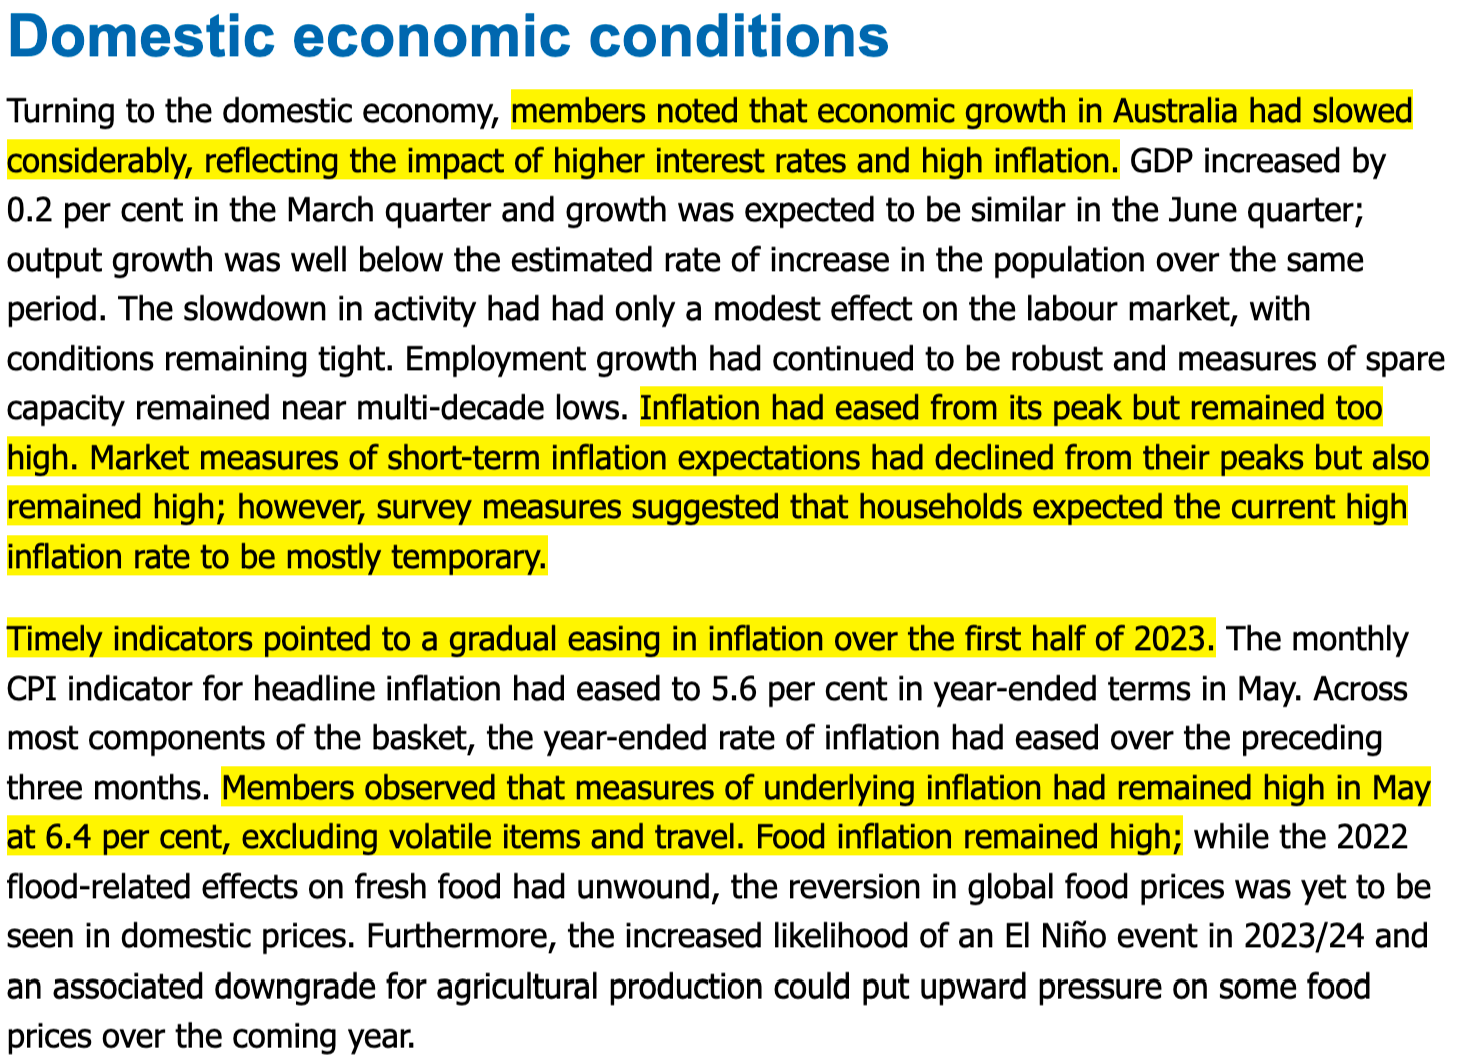
The Minutes were a tiny bit hawkish with members agreeing that “some further tightening may be required”. Here are the most important points and the highlights below:
Members noted that inflation in Australia remained very high, despite a decline in prior months, and was currently not expected to return to the top of the target range until mid-2025.
The housing market had stabilised, with housing prices rising once again. The tightening of monetary policy was still working its way through the economy, including as fixed-rate loans matured.
Members discussed two options for monetary policy at this meeting: increasing the cash rate by a further 25 basis points; or holding the cash rate unchanged.
Case for a 25 bps hike: inflation was forecast to remain above target for an extended period, weak productivity was contributing to strong growth in unit labour costs, tight labour market, policy rate in Australia was still lower than elsewhere, other countries' experiences with upside risks to inflation.
Case for a hold: inverted yield curve, lags in transmission of monetary policy, demand for labour also responds with a lag.
Members agreed that some further tightening may be required to bring inflation back to target within a reasonable timeframe.


Confab, Speakers, News
European Central Bank
Vasle. Mon: Core inflation remains high and resilient.
Nagel (Hawk). Mon: Expects a 25 bps hike in July, must wait to see what data signals for September, too early to declare victory over inflation, does not currently see a risk of overtightening, core inflation is very sticky, a hard landing is unlikely. Wed: 25 bps rate hike very likely next week, inflation is a greedy beast, would be a mistake to ease up on the inflation fight too soon and cut rate prematurely.
Knot (Hawk). Tue: Rate hikes beyond July are possible but not certain, we need to hike rates in July, looks like core inflation has plateaued, there is still a lot of data between now and September, optimistic to see inflation reaching 2% in 2024.
Visco. Tue: Inflation is stubborn and more complicated, manufacturing is slowing while services are booming.
Stournas. Wed: Inflation is falling and more tightening could hurt the economy, another 25 bps of rate hikes would be enough.
Bank of England
Ramsden (Hawk). Wed: Inflation has begun to fall significantly but remains much too high, latest inflation data shows it is still a bit higher than expected, if there is evidence of persistent pressures then further tightening would be required, the impact of bank rate increases taking quite a bit longer to come through than expected, QT should be thought of as operating in the background, would like to increase the pace of gilt stock reduction, cannot rule out next interest rate cycle will get back to 0 lower bound and need to have room for new QE.
Bank of Japan
Ueda. Tue: Still some distance to sustainably achieving 2% inflation target, the BOJ have been patiently maintaining easy policy, our narrative on monetary policy won't change unless our assumption on the need to sustainably achieve 2% target changes.
Kishida. Thu: Must ensure sustained exit from deflation, must create a society where wage hikes become a norm, must be mindful of impact of any inflation overshoot on real income.
Kanda. Fri: There is some expectation and speculation about the possibility of tweaking monetary policy, excessive FX moves are undesirable, watching with a sense of urgency, considerung all options, declines to comment about current situation.
Sources. Fri: Reuters, five sources familiar with the central bank's thinking: the BOJ is not likely to introduce any changes to YCC next week, many policymakers see no imminent need to take fresh steps on the matter, no consensus as to when they might start to phase out stimulus measures, board seen revising up this year's inflation forecasts, BOJ prefers to wait for more data.
People’s Bank of China
SAFE. Fri: Will forcefully prevent sharp volatility in the yuan, will keep the yuan basically stable at balanced levels in a forceful manner, will comprehensively use policy measures to stabilize expectations, Fed tightening is coming to an end and spillover effect is weakening.
Economic Data
The following PDF file contains the entire review section of the newsletter minus the central bank speakers. Going forward, the review section will only be published in PDF form:
Monday, 17.07.23


Tuesday, 18.07.23


Wednesday, 19.07.23


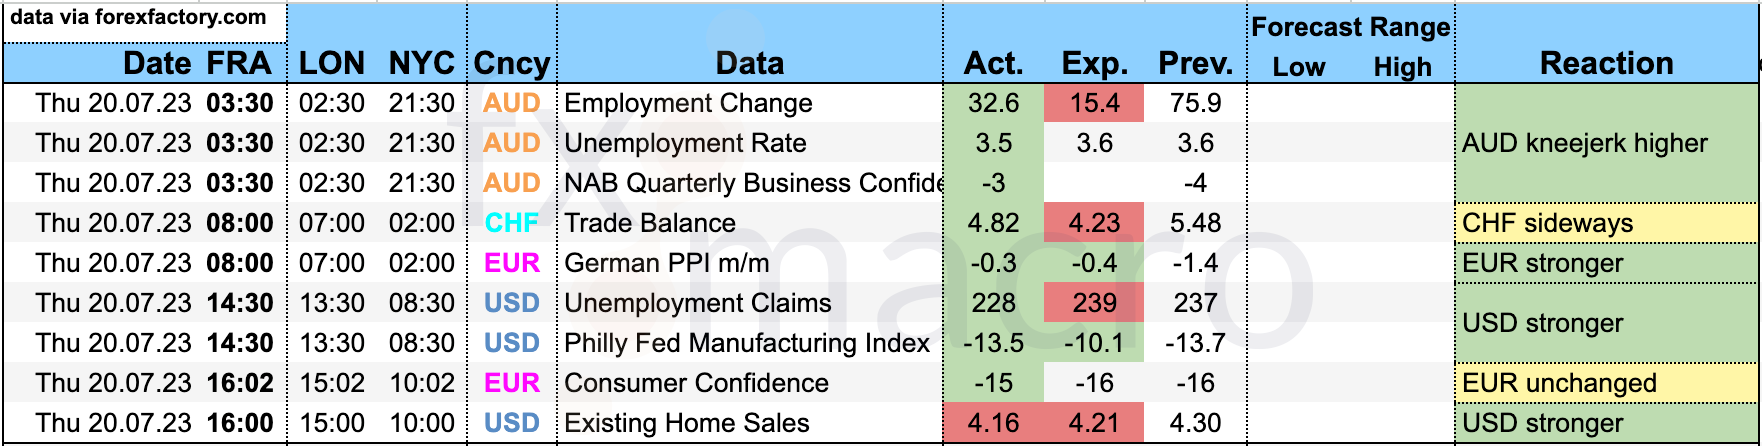
Thursday, 20.07.23

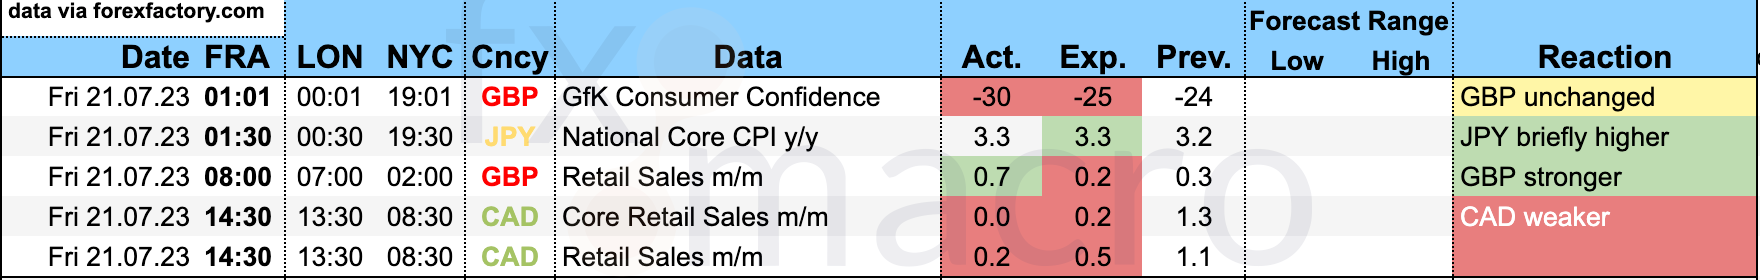
Friday, 21.07.23

The following section contains the Market Analysis. I’ve included a first version of that section as a PDF. Let me know what you think and don’t hesitate to reach out if you have any feedback (usability, layout, colour scheme, how readable is it, etc.).
Market Analysis
Growth and Inflation
The Atlanta Fed GDPNow model estimates Q2 growth at 2.4%:

The NY Fed Weekly Economic Index is slowly ticking higher, it’s now at 1.52:

Citi Economic Surprise Indexes:
USD and EUR look like they’ve put in their top and bottom, respectively
GBP has come down further
AUD, NZD and CHF are improving
CAD and JPY are going nowhere
China remains at its low
The global CESI is going sideways

The CESI spread EUR-USD is showing some improvement too but the disconnect from EURUSD remains:

The correlation between the US CESI and the S&P 500 remains positive: good news is good news right now:

OECD Composite Leading Indicators:
The US is improving slowly, the UK’s improvement is slowing
Australia is mostly flat
Canada keeps worsening
Germany has turned lower again
China is outperforming

Bloomberg PMI heatmap:
No updates since last week
The US and Canada have weakened
The Eurozone and Switzerland remain red
Germany and the UK are worse compared to May
Australia remains deeply red
China, South Korea, Japan, Taiwan, Vietnam all remain unchanged and weak

Inflation breakevens and 5y5y forward inflation expectations ticked up quite a bit this week, RINF is also higher:


Citi Inflation Surprise Indexes:
Updated monthly, so no change this week
Ticks up in: AUD, NZD, CHF, CNY
Ticks down in: USD, EUR, CAD
A larger drop in JPY

NY Fed Consumer Inflation Expectations continue to drop over the 1-year horizon while the longer-term expectations are still creeping higher.

Yields
10-year yield performance:
Overall, 10y yields are performing similarly over one month
New Zealand is the outperformer, followed by Japan
The UK and Switzerland are the underperformers

UK 2s and 10s look weak compared to DE and US yields:

2-year, 10-year yields and 2s10s:
Same here: UK 2y yields have underperformed recently, 2s10s have been bull steepening for two weeks
US 2s10s are bear flattening with 2s outperforming 10s ahead of FOMC next week
The NZ curve is also bear flattening
The Canadian curve steeped after this week’s CPI but it’s mostly a bull steepener driven by 10s and not by the short-end

Global yield curve comparison (2s10s):
All G8 yield curves except for Japan are firmly inverted

Central Banks and the US Dollar
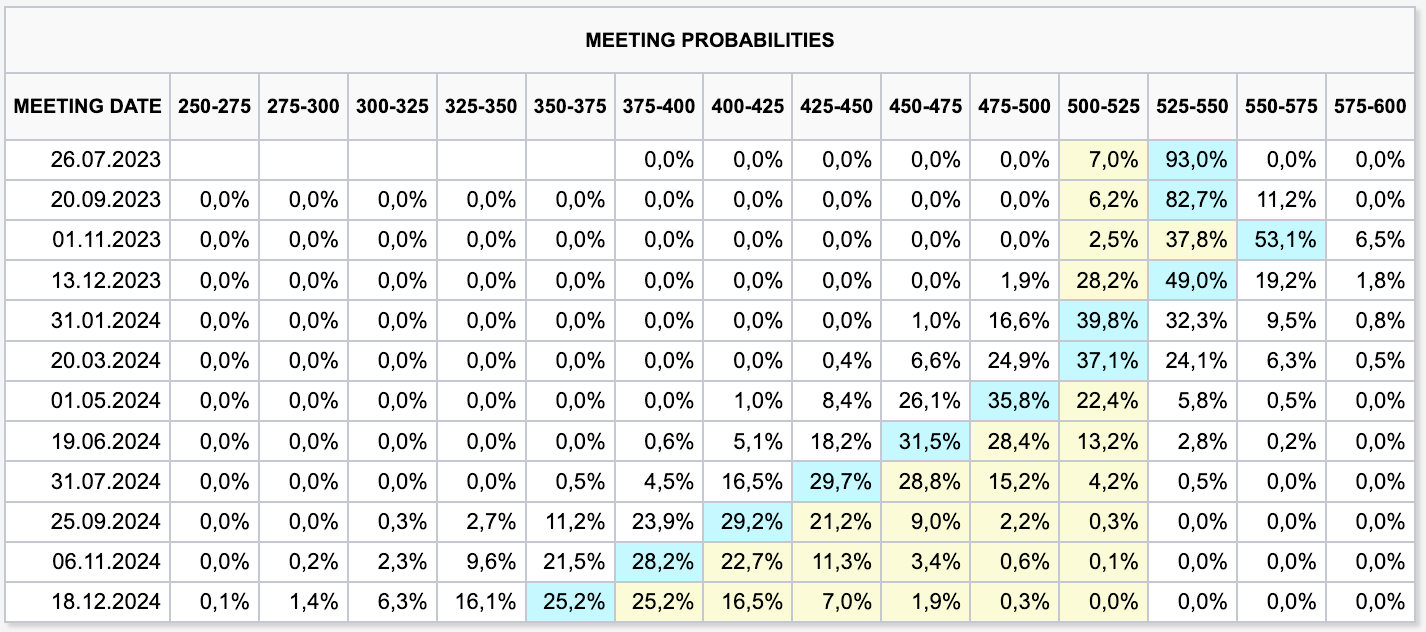
FOM meeting probabilities according to CME’s FedWatch Tool:
Next week’s meeting is firmly priced at another 25 bps hike with 99% probability
The following meetings are all expected to see no change to the FFR with probabilities skewed to the upside
The first rate cut is priced in for March 2024
Overall, there hasn’t been much change compared to last week

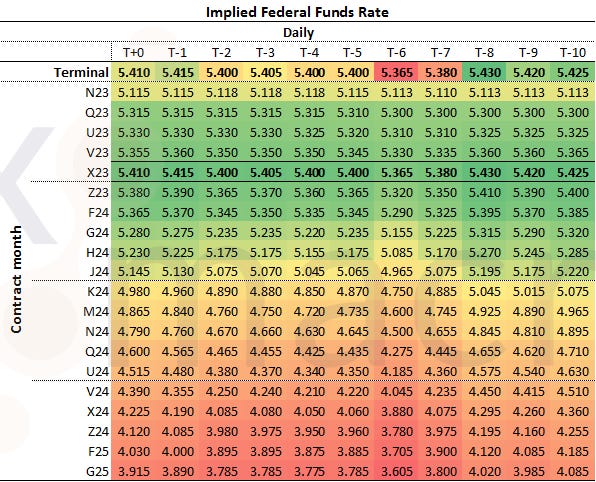
Fed Funds forward curve:
Not much change compared to recent weeks
The Fed is expected to cut rates at every meeting through February 2025
Here's the same data in table format:
The terminal rate remains priced in for the November contract (X23)
ASX RBA Rate Indicator:
Expectations for another 25 bps hike at the August RBA meeting have ticked up again

Sectors and Flows
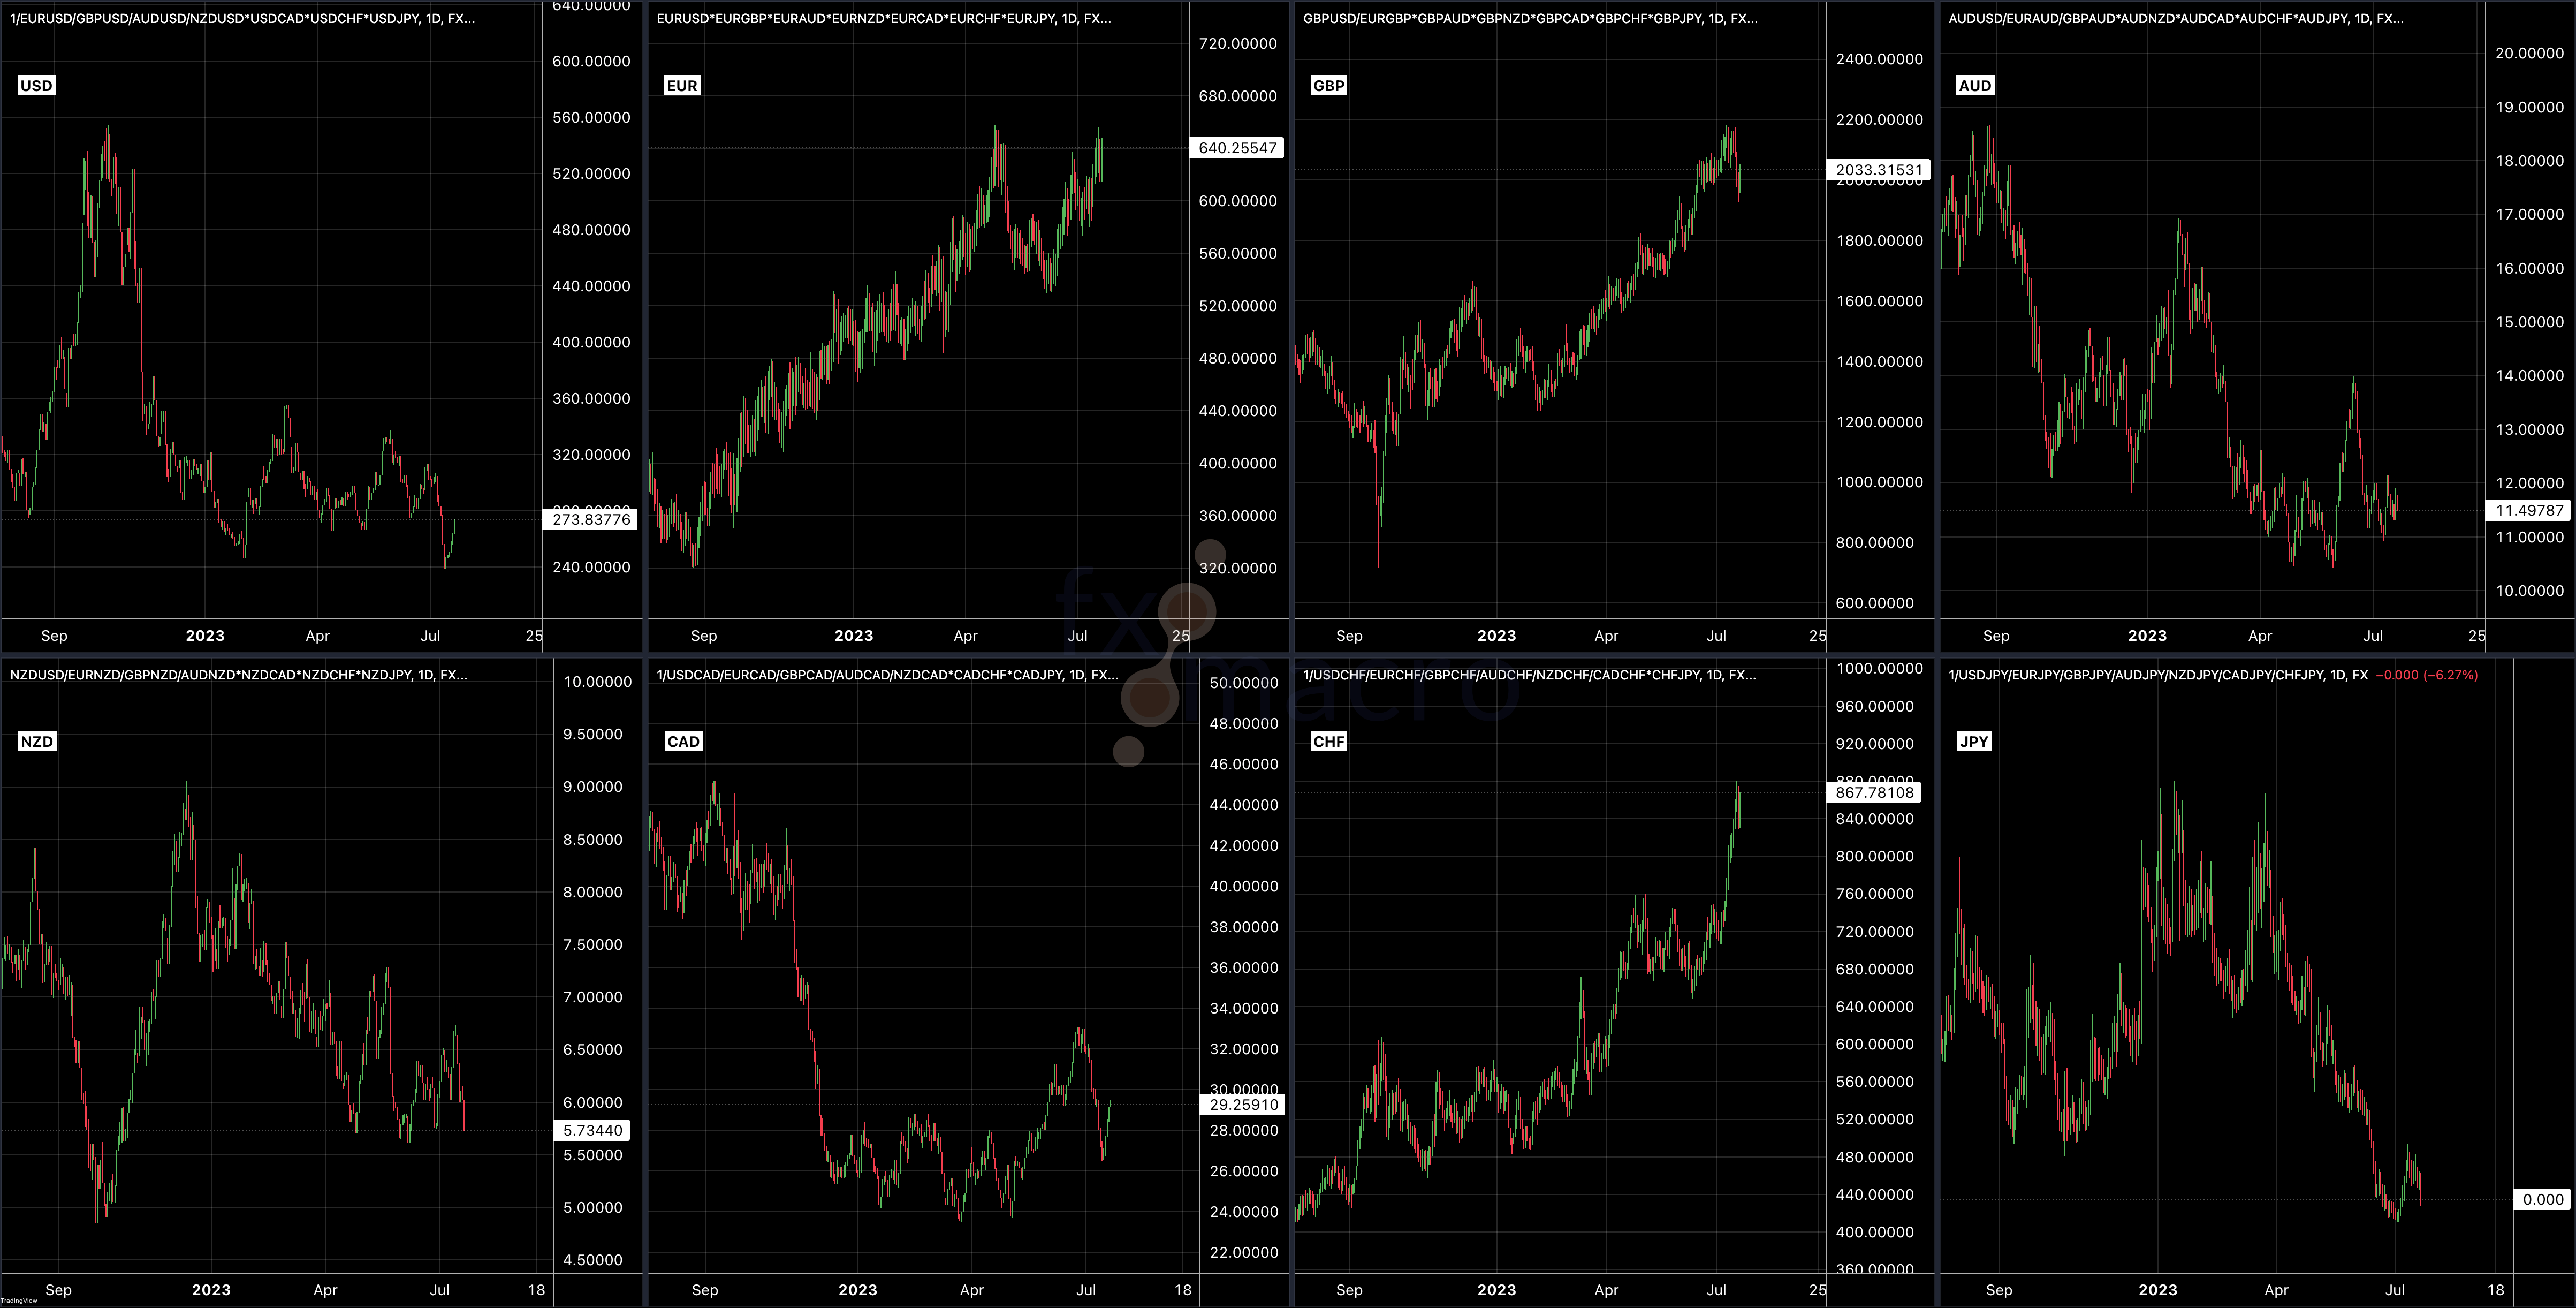
Currency strength:
Over three months, GBP and CHF are the outperformers and JPY is the underperformer by far but AUD, NZD and the USD are negative
The outperformers over one month are CHF and EUR; the brief phase where it looked like JPY could gain some strength is over
Last week saw USD and CAD outperforming; NZD had the worst performance, and JPY was just a tad better

Currency strength charts:
Equity sector performance:
Outperformers: SMH (Semiconductors), XLK (Tech), XLY (Consumer Discretionary)
Underperformers:XLU (Utilities), XLE (Energy), XLP (Staples)
Energy keeps underperforming, defensive sectors are underperforming as well
Overall, there’s nothing here that would be worrisome

Similar data but different chart:
Offensive sectors outperforming over one and three months, defensive sectors underperforming
Last week saw a bit of defensive sector rotation

Sector breadth is at a maximum with all sector ETFs positive over 30 days:

Sector thumbnail charts:
Nothing looks terrible here
XLV and XLU put in quite a rally this week
XLF is slowly going higher

International stock markets:
Nasdaq is still the outperformer
Brazil has recently moved sideways but it remains near the top of the list
Japanese and Indian equities have performed well too
Hong Kong, the UK, Switzerland and France are the underperformers

Sentiment and Positioning
The AAII Bull-Bear spread has now put in the fourth-highest high on the chart; it’s just a tad below 30 which is extreme.

Currency sentiment:
Bullish sentiment: NZD, AUD, USD, CAD
Bearish sentiment: CHF, GBP, EUR

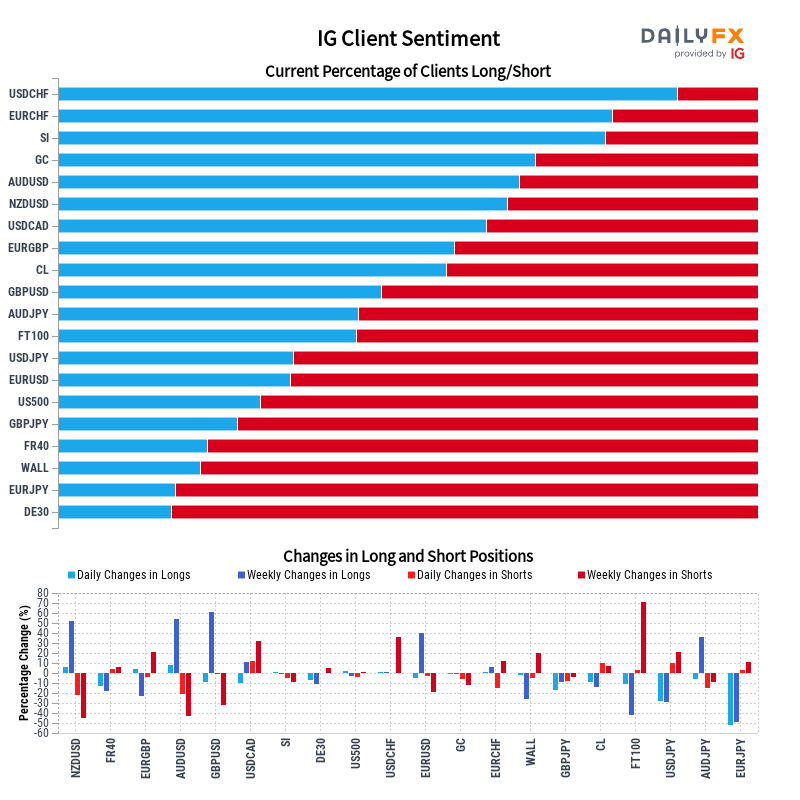
Different sentiment source:
USDCHF and EURCHF are the currencies with the most bullish sentiment
AUDUSD and NZDUSD also have very bullish sentiment
JPY pairs are all bullish on JPY
Commitment of Traders and futures performance:
Equity futures were mixed with NQ negative vs. the other three futures up; positioning is neutral but the 1-week net position changes for Commercials and Large Traders in YM at -3.09 and +2.74, respectively, which could be short-term bearish
Treasury were all negative this week, positioning remains pretty much unchanged with ZT and ZF at bullish extremes
Currency futures had a mostly negative week except for DX and 6C; positioning for 6E has returned to a bearish extreme with 1-week changes in Commercial and Large Trader net positions at around -3 SD, which is short-term bearish; similar 1-week changes in 6J
Bitcoin had another soft week but maintains an RSL above 1.00
Energy futures are all in the green, even NG has reclaimed an RSL >1.00, which means it’s now above its 26-week moving average
Metals were mixed with HG negative once again and SI now at a bearish positioning extreme (plus a -3.71 SD move in 1-week Commercial net positions and a corresponding change in Large Trader positions, which is short-term bearish)
Grains were all higher this week, positioning remains neutral
Softs were also up, the bearish positioning extreme in CC remains

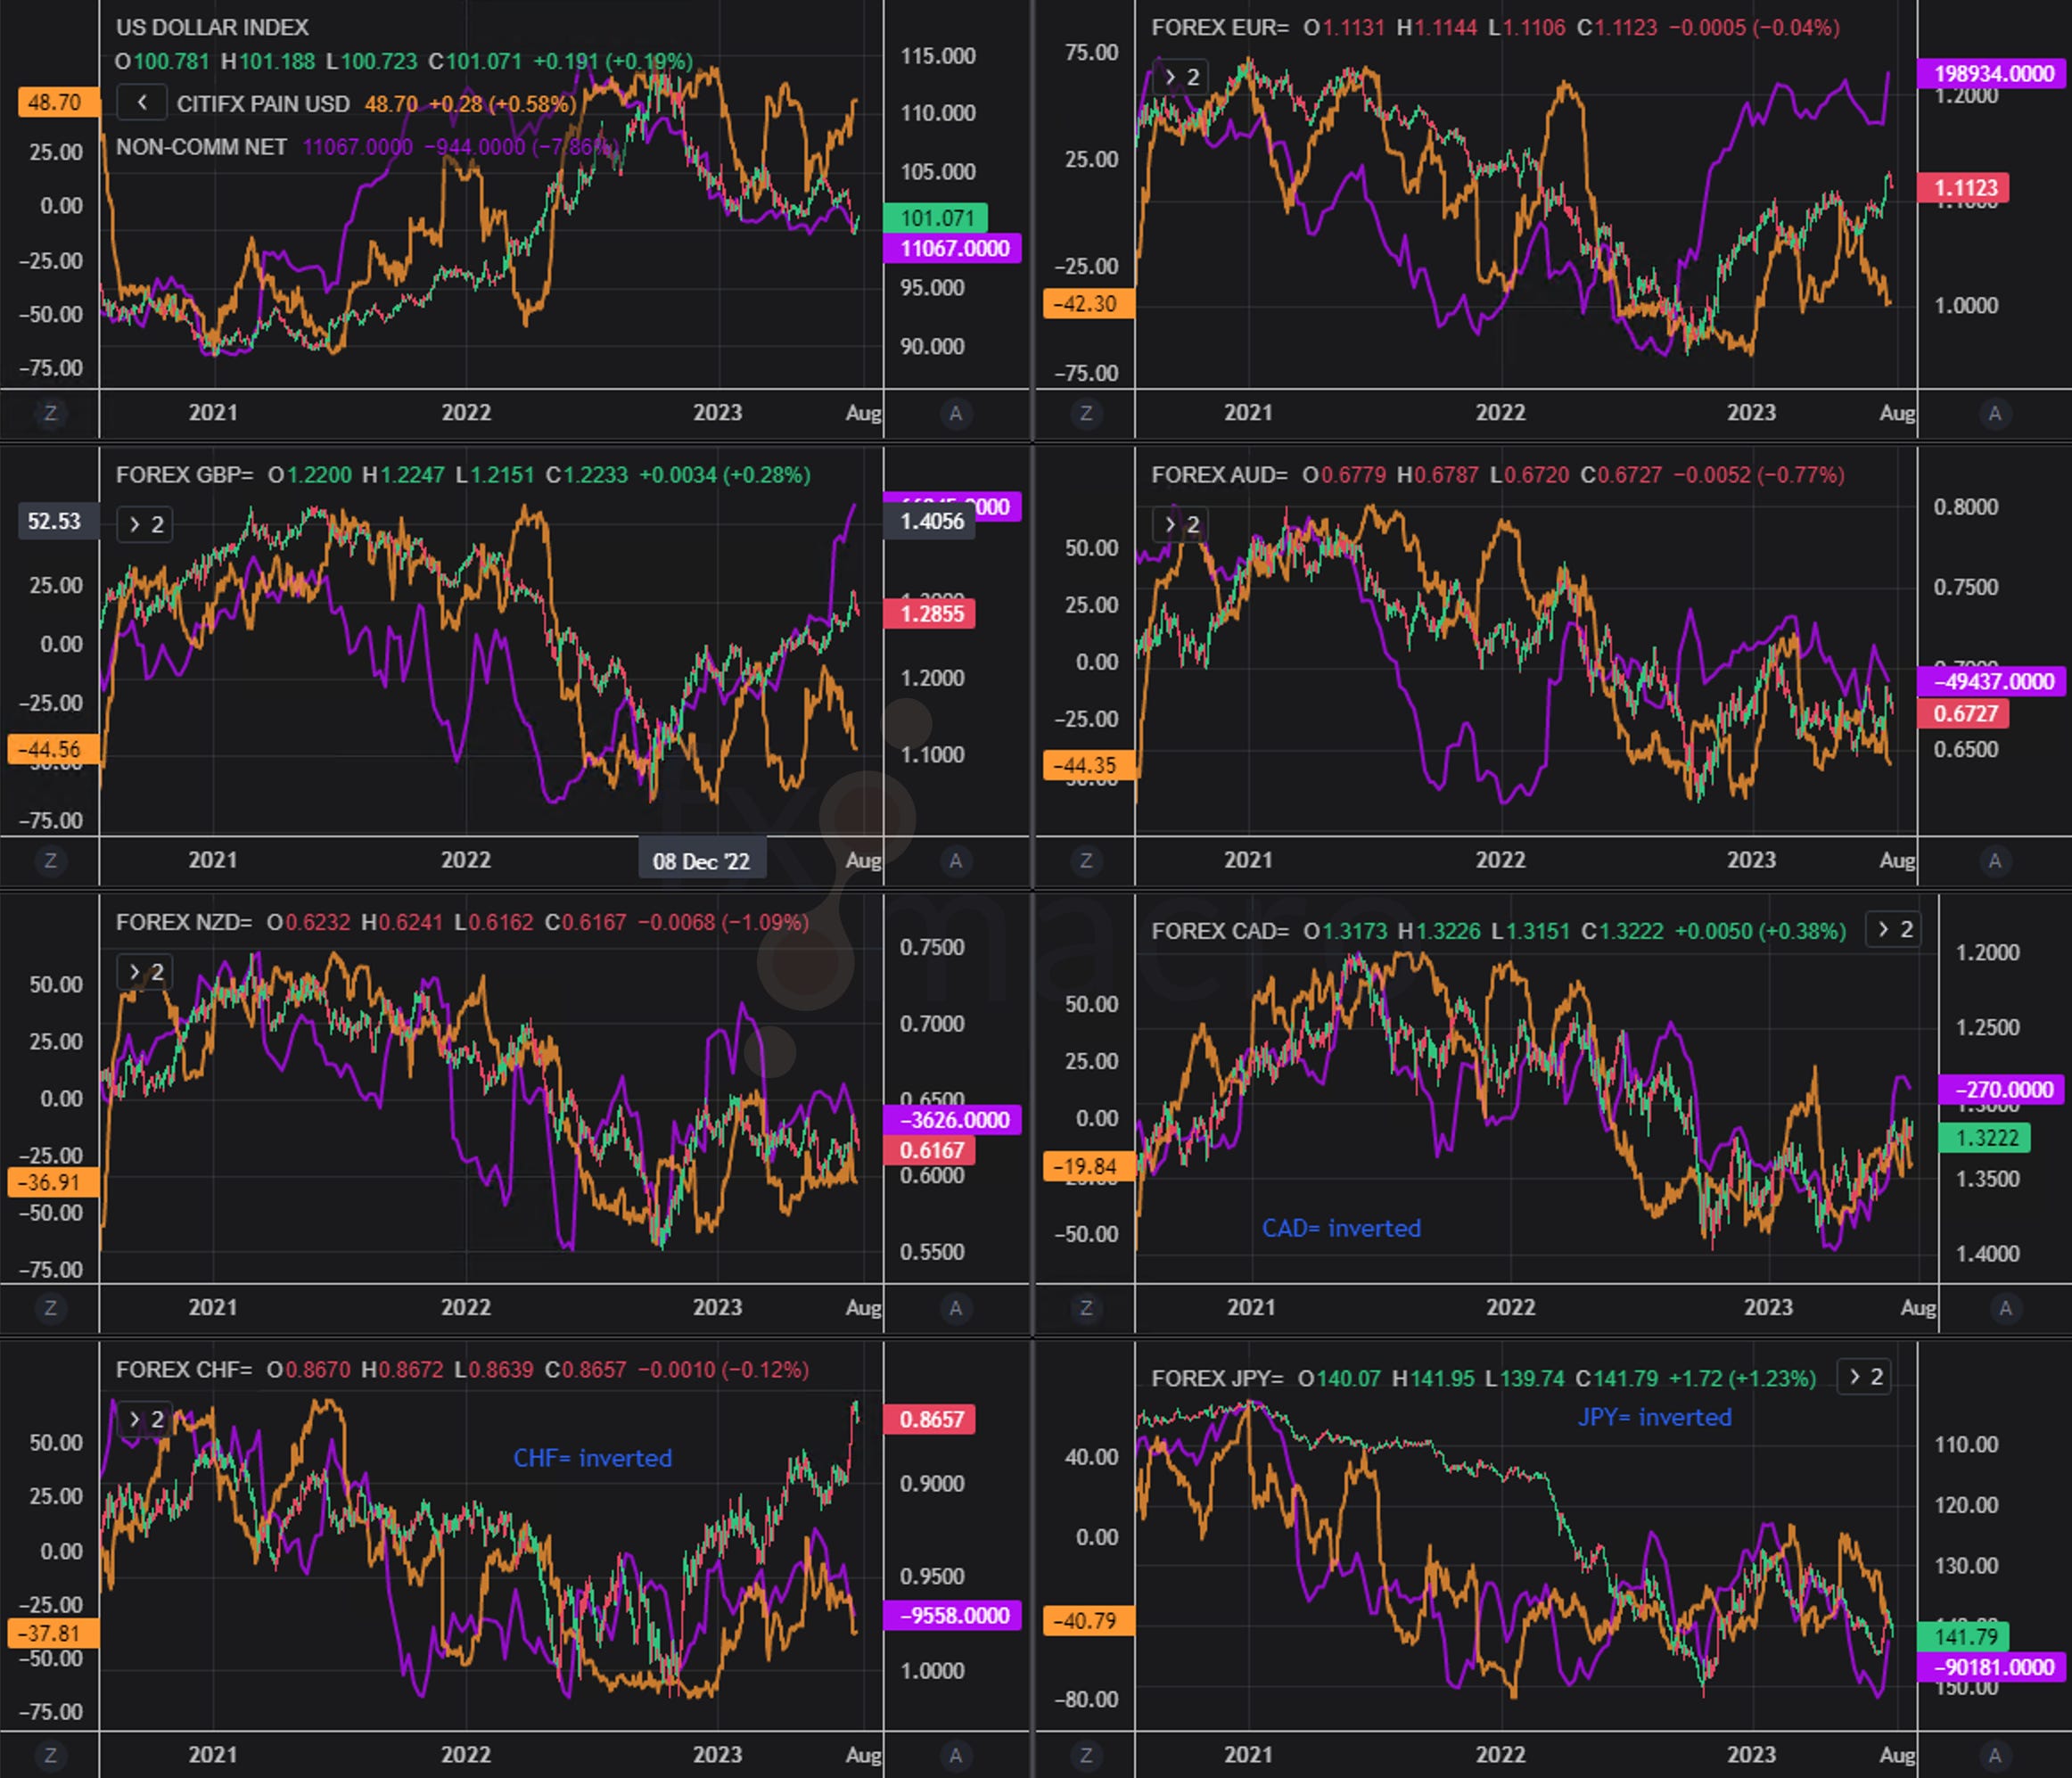
COT/TFF dealer net positions for currency futures:
USD is now at a bullish 2-year high
6E sits near and 6B at its multi-year bearish low
6J has backed off its high and remains well below last year’s extreme

Citi PAIN Indexes show the USD long has increased:

Combined COT/PAIN chart:
What strikes me here is the divergence between Large Trader positions and PAIN on one side and CHFUSD (inverted USDCHF on the chart, bottom left) on the other, implying that the recent strength in CHF is unjustified
Credit spreads continue to contract:

The Credit Spread Index has also come down a bit further:

Market Risks
Currency volatility has increased a bit but doesn’t look stressed:

The VIX term structure is in contango and well above spot:
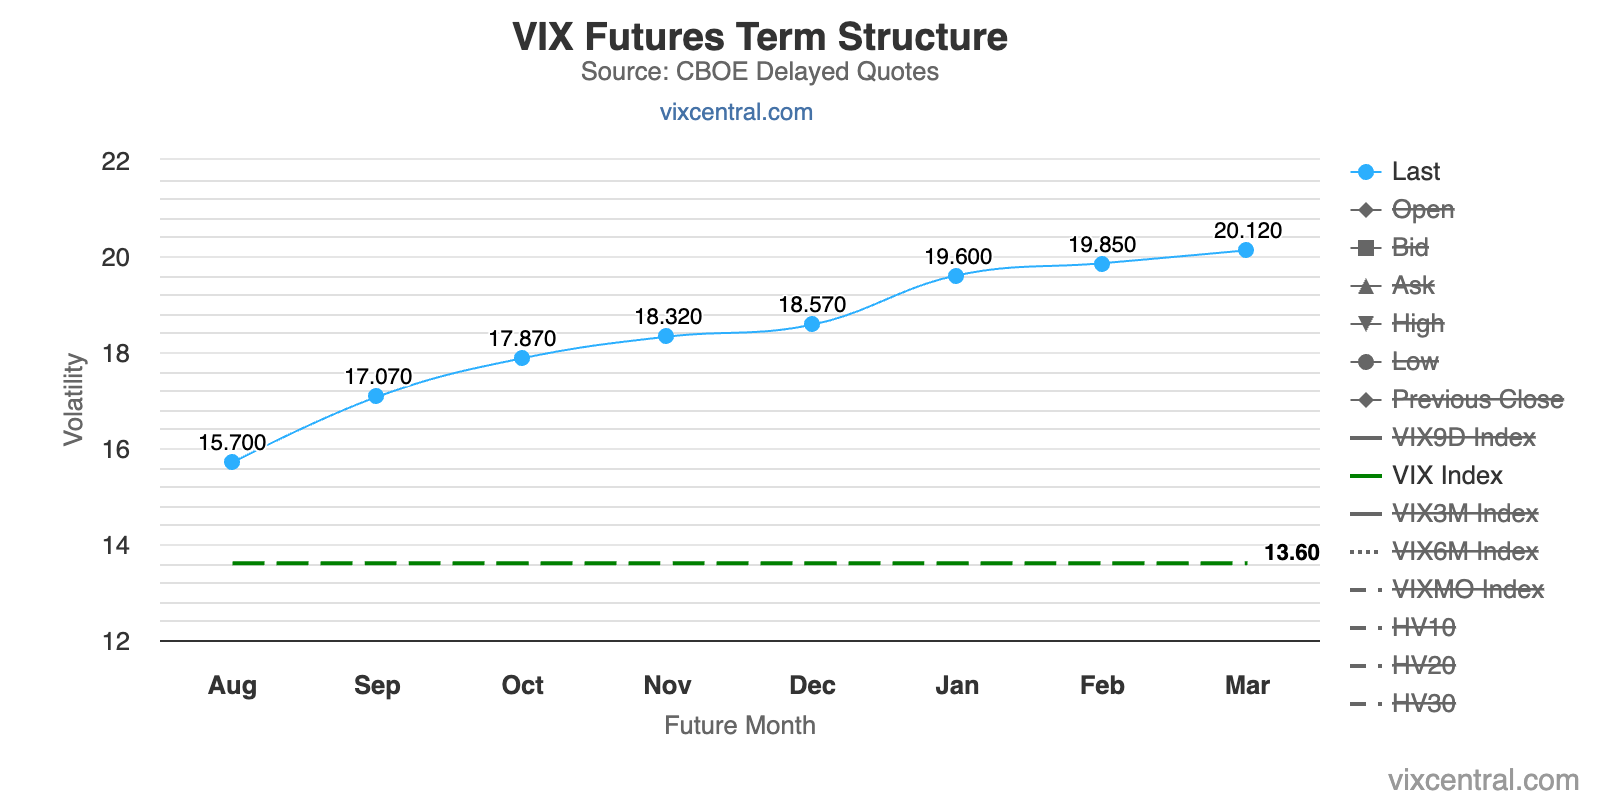
Volatility indexes:
VIX is at a 13-handle, VVIX is 93, MOVE at 106
There’s nothing really worrisome here, VIX is low, VVIX continues to trade in its 80-100 range and MOVE is trending lower
Skew is flattening as traders are heading less downside


The CNN Fear & Greed Index is still in extreme greed territory:


Various
The NYSE Advance/Decline Line is moving higher along with price, the divergence we’ve seen in May/June has been resolved to the upside:

Stocks above their 200-day moving averages look bullish for both the S&P 500 and the Nasdaq 100:


Stocks above their 50-day moving averages also look bullish but have reached overbought levels for both indexes:


25-delta risk reversals:
The only thing that’s noteworthy is the divergence in USDCNY, which is bearish USD

Market Dashboard:
Trend metrics are all in the green except for NQ which has underperformed recently
Distribution days have improved but are still too high in most indexes
Volatility metrics, breadth and put/call ratios are unremarkable

Links to relevant central bank releases in previous editions of this newsletter:
Fed
FOMC Statements: 25/2023 | 19/2023 | 13/2023 | 06/2023 | 50/2022 | 45/2022 | 39/2022 | 31/2022 FOMC Meeting Minutes: 28/2023 | 22/2023 | 15/2023 | 09/2023 | 02/2023 | 47/2022 | 42/2022 | 34/2022 | 28/2022 | 25/2022 Crib Sheets: 05/2023 | 50/2022 | 37/2022
ECB
Rate Statements: 25/2023 | 19/2023 | 12/2023 | 06/2023 | 50/2022 | 44/2022 | 37/2022 | 30/2022 Meeting Minutes: 28/2023 | 22/2023 | 17/2023 | 10/2023 | 04/2023 | 47/2022 | 35/2022 | 28/2022 | 21/2022 Economic Forecasts: 21/2022 Crib Sheets: 11/2023 | 05/2023 | 50/2022 | 43/2022 | 36/2022
BOE
Rate Statements: 25/2023 | 20/2023 | 13/2023 | 06/2023 | 50/2022 | 45/2022 | 39/2022 | 32/2022 | 25/2022 Financial Stability Reports: 28/2022 Crib Sheets: 05/2023 | 50/2022 | 37/2022
RBA
Rate Statements: 28/2023 | 24/2023 | 19/2023 | 15/2023 | 11/2023 | 07/2023 | 50/2022 | 45/2022 | 41/2022 |37/2022 | 32/2022 | 28/2022 Meeting Minutes: 25/2023 | 21/2023 | 17/2023 | 09/2023 | 51/2022 | 47/2022 | 43/2022 | 39/2022 | 34/2022 | 30/2022 | 26/2022 | 21/2022 Statements on Monetary Policy: 19/2023 | 07/2023 | 45/2022 | 32/2022 Crib Sheets: 40/2022 Financial Stability Reports: 41/2022
RBNZ
Rate Statements: 28/2023 | 22/2023 | 15/2023 | 09/2023 | 47/2022 | 41/2022 | 34/2022 Meeting Minutes: 07/2023 Crib Sheets: 40/2022
BOC
Rate Statements: 28/2023 | 24/2023| 15/2023 | 11/2023 | 05/2023 | 50/2022 | 44/2022 | 37/2022 Crib Sheets: 43/2022 | 36/2022 Summary of Deliberations: 25/2023 | 18/2023
SNB
Rate Statements: 25/2023 | 13/2023 | 50/2022 | 44/2022 | 39/2022 | 25/2022 Crib Sheets: 50/2022 | 37/2022
BOJ
Rate Statements: 25/2023 | 18/2023 | 11/2023 | 04/2023 | 51/2022 | 39/2022 | 30/2022 | 25/2022 Summary of Opinions: 26/2023 | 20/2023 | 13/2023 | 05/2023 | 52/2022 | 46/2022 | 41/2022 | 31/2022 Crib Sheets: 43/2022
Photo Credit: Midjourney with the prompt: an oil painting of a forex trader preparing for the FOMC next week in front of his computer, white canvas, white background, vibrant color palette, colorful, dripping paint, bold graphic design elements, hyper realistic
Is there a more thorough review of a week available? Even behind a pay wall...i doubt it. So, thank you so much for the time and effort so obviously put into this.
great comprehensive take, thank you!