

FX & Macro Outlook for Week 33/2022
August lull... not a lot of data, but a very interesting market

Welcome to issue #18 of FX & Macro Weekly.
This newsletter is quite long, so there's a Summary section at the top. Everything you find there is derived from data and news I show in detail in the second and third parts of the newsletter (Week in Review and Market Analysis). I encourage you to go through those parts, because they are basically the reasoning behind the conclusions I present in the Summary. The final section is a collection of things I read during the week that influence my thinking.
I've also launched a small side-newsletter called Extras. It's going to be a mid-week podcast write-up. Check it out here if you're interested, there's a ton of interesting macro views and thoughts in there:

If you like this newsletter, please consider subscribing and sharing it or forwarding it to others who might be interested. I'm also on Twitter @fxmacroguy if you want to reach out.
One more thing. You seem to like newsletters, so here's a great way to discover new stuff to read for free: The Sample. They will regularly send you an issue of a different semi-random newsletter you might be interested in. If you sign up using my referral link, I get bonus points and my newsletter will be forwarded to others to check out.
Now let's get started…
Table of Contents
Summary
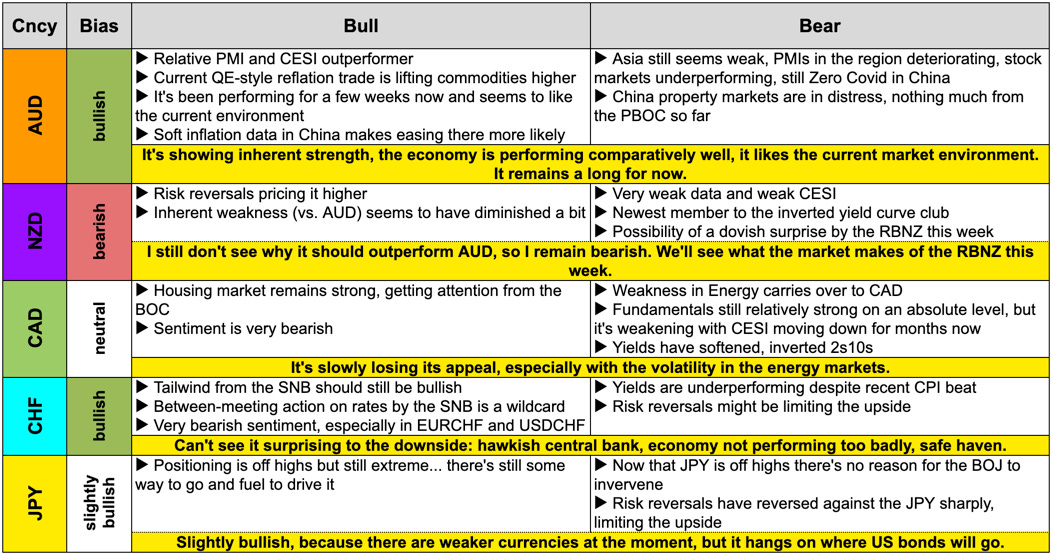
Playbook for next week
This is the shortest possible summary of everything you will find in the rest of this newsletter.

A few words about the current market. Two weeks ago I wrote:
The whole macro picture is still so weak that I find it really hard to write down: we're in a reflation trade now. I don't know how long it will last, but my guess is: until we get a sense how the September FOMC meeting might play out.
Yes, we are still in that trade, everybody hates it (including me), because fundamentally we shouldn't be. But we see it everywhere:
The market is ignoring hawkish Fedspeak
It's ignoring hawkish data (NFP last week)
It's rallying on dovish data (CPI this week)
Sector performance is reflationary, high-yield spreads are narrowing, breadth is strong, the Aussie is performing, Commodities are off lows and so on
I still don't believe it's going to last, but for now it is what it is. So, again I reiterate my main message from the last two weeks:
Strong opinions, weakly held. Being nimble. Trading the market, not expectations. That's going to be even more essential for the coming weeks.
Relevant market risks I have on my radar (it's obviously not a comprehensive list and mostly unchanged from last week):
Europe: huge uncertainty regarding future of gas flows from Russia; an unexpected resolution of the conflict seems very unlikely, but it could escalate on multiple fronts (gas, energy, militarily) very quickly
UK: don't have a clear idea about the impact of the Tory leadership race yet (potential for negative impact on the sterling is there given the comments from Liz Truss), the Northern Ireland protocol still remains unresolved
Global markets: the risk from commodity market squeezes spilling over seems to have diminished a bit
China/Taiwan: keeping an eye on the Taiwanese stock market as a risk gauge
Economic Calendar for next week

Important levels to watch and look out for in the Majors

Week in Review
Central Banks
Confab, Speakers, News
Federal Reserve
Bowman (Neutral). Sat: Supported the 75 bps hike last week, believes that similarly-sized increases should be on the table until we see inflation declining in a consistent, meaningful and lasting way. Wants unequivocal cooling of inflation before changing outlook.
Daly (Neutral). Sun: Have to keep an open mind about what to do in September, there are two inflation reports and another jobs report coming out, need to be data-dependent. Thu post-CPI: We're not near done yet in battle against inflation, 50 bps hike is my baseline, being prescriptive and jumping to 75 bps isn't what we need. Fri: 50 bps in September is base case, open to 75 bps if data shows it, 3.4% FFR at the end of the year would be about right, not just looking at a single CPI report, doesn't want to be head-faked by inflation, highest risk is too high inflation, wants financial conditions to remain tight.
Bullard (Hawk). Tue: Wants to get rates to 3.75-4% by the end of the year and then see what happens in Q1. Sees rates a little bit higher than he thought even a few months ago, it's too early to claim inflation has peaked. Wants to see clear improvements in inflation across a range of indicators and not just one measure ticking down.
Kashkari (Dove). Wed post-CPI: We're far, far away from declaring victory on inflation, soft CPI print doesn't change my outlook on rates, expecting 3.9% at the end of the year and 4.4% at the end of next year. Cutting rates in early 2023 not realistic. We will likely raise rates and leave them there until inflation is well on its way to 2%. We may be in a recession soon, risk of recession not deterring him from doing what's needed.
Evans (Neutral). Wed post-CPI: Expects rate increases this year and next year, Fed funds to be at 3.25-3.5% at the end of this year and top at 4% in 2023. Sees next year's Core PCE closer to 2.5%, GDP at 1.5-2.5%. Would take something adverse to trigger a recession, sees economy growing in H2.
Barkin (Hawk). Fri post-CPI: Wants to see a period of inflation under control and running at target (2%), more tightening to come, wants positive real rates across the curve. Economy is fundamentally sound, demand is softening, labour market still strong. Not committing to 75 bps hike, still a lot of data before September meeting. Doesn't see a problem with shrinking balance sheet as rates rise.
Bank of England
Ramsden (Hawk). Tue: BoE will probably have to raise rates again. Not ruling out that recession risks force BOE to cut rates next year, gilt selling will continue nevertheless, QT will continue in the background.
Pill. Wed: Rising rates will only have an effect around the end of 2023, wage growth running too fast, good central bankers don't try to be popular.
Economic Data
Monday, 08.08.22


Tuesday, 09.08.22


Wednesday, 10.08.22


Thursday, 11.08.22


Friday, 12.08.22

Market Analysis
Growth and Inflation
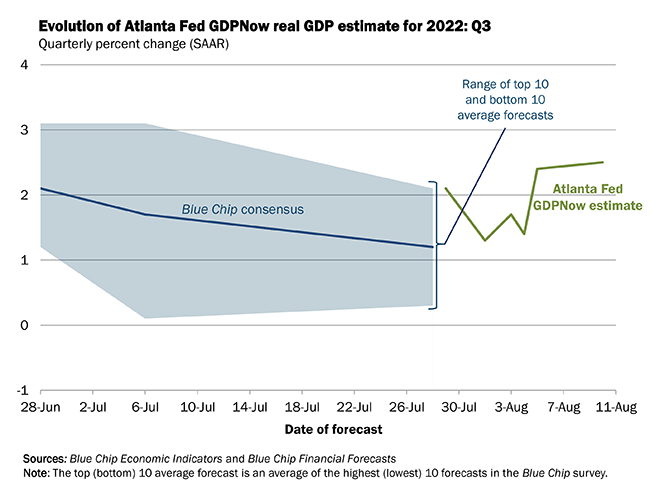
The Atlanta Fed GDPNow model estimates Q3 growth at 2.5%:
The NY Fed Weekly Economic Index estimates four-quarter GDP growth at 3.17%:

Citi Economic Surprise Indexes:
USD and GBP slowly moving higher
EUR and AUD have levelled off
CAD is deteriorating further

Global CESI is moving higher again, driven my the DM index:

Global PMIs:
Eurozone and Canada are weakening
US, UK, Australia, Japan remain unchanged
Taiwan has deteriorated markedly, China and South Korea are weaker as well
Overall there’s a lot more red now than during the previous months

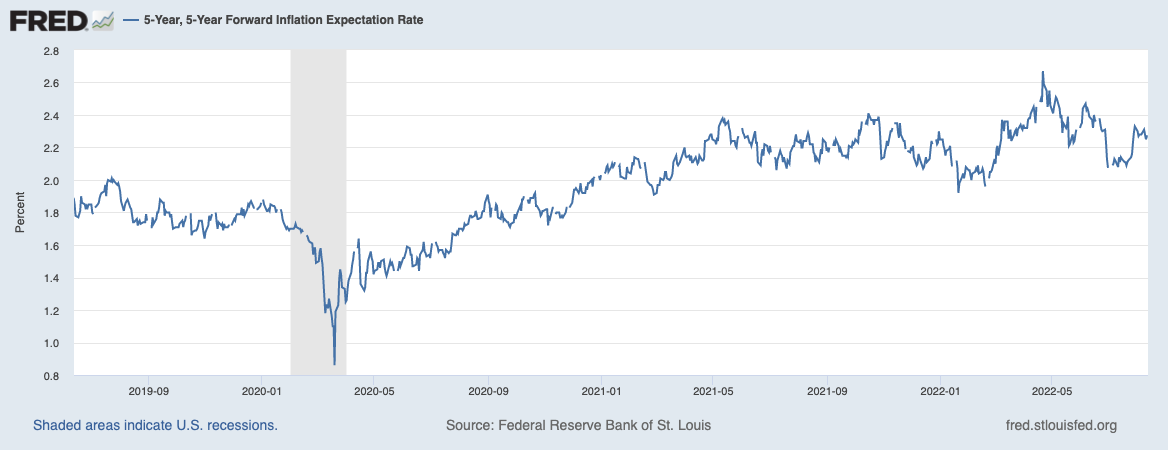
5y5y forward inflation expectation swaps remain in the middle of their range:
The inflations expectations ETF is also in the middle of its range:

Citi Inflation Surprise Indexes remain unchanged:
USD moving higher again, CHF still at highs
AUD and CAD are down

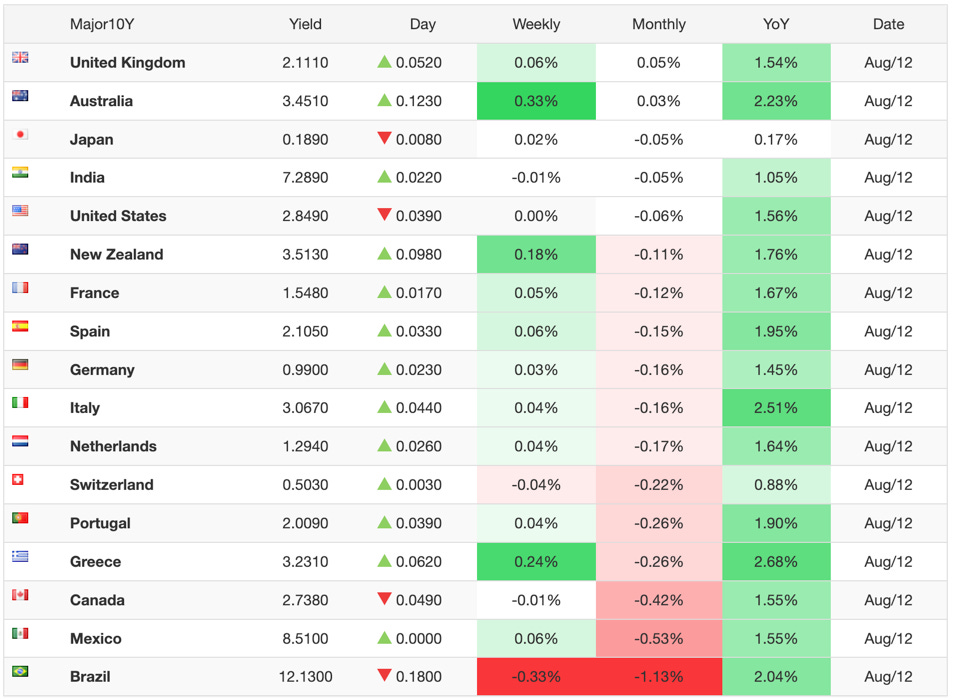
Yields
See chart and table below:
Broadly sideways action in 2s and 10s
It’s really hard to make out who’s leading and lagging here
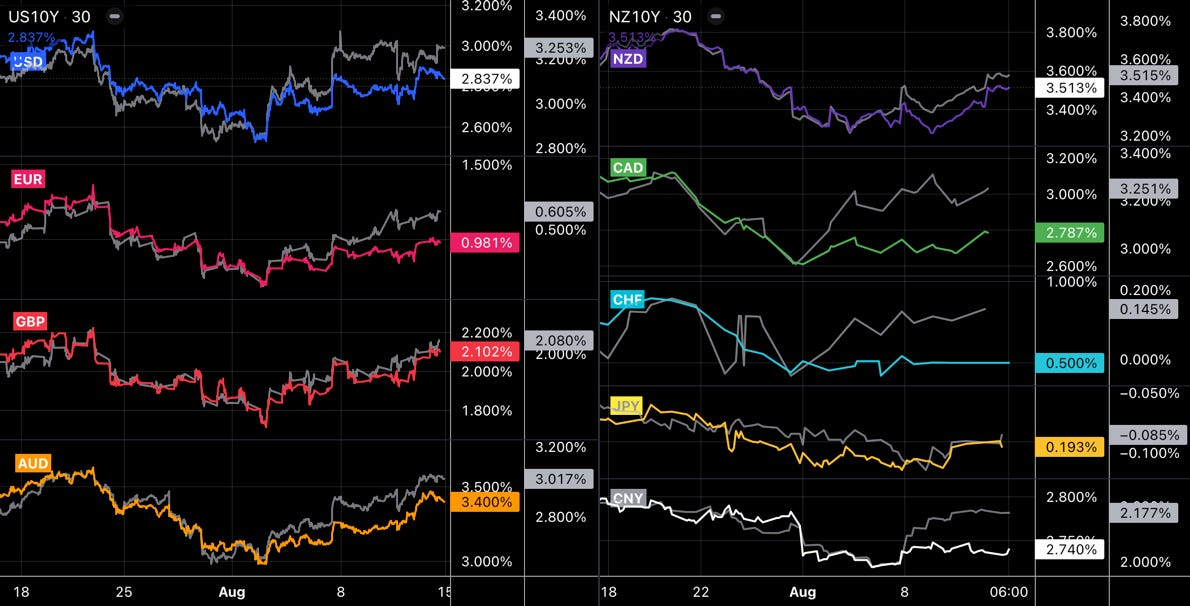
Yield curves along the 2s10s spread are flattening globally, Japan and China being the only exceptions. This is how the bond market prices estimated future growth:

Central Banks
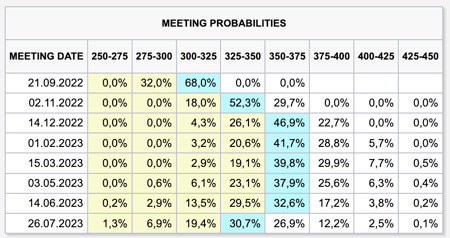
Latest FedWatch movements:
A 50 bps hike in September is now 55% likely while 75 bps have a probability of 45%
The November meeting is priced with a 50 bps hike
The terminal rates remain around 350-375 bps
The major change compared to the week before is in the front end and it’s a reflection of how single data prints like this week’s CPI shake up expectations for the September meeting in absence of credible forward guidance.

Short-term interest rates give some credibility to Fedspeak talking down the possibility of rate cuts next year. Hawkish for (a bit) longer:

Sectors and Flows
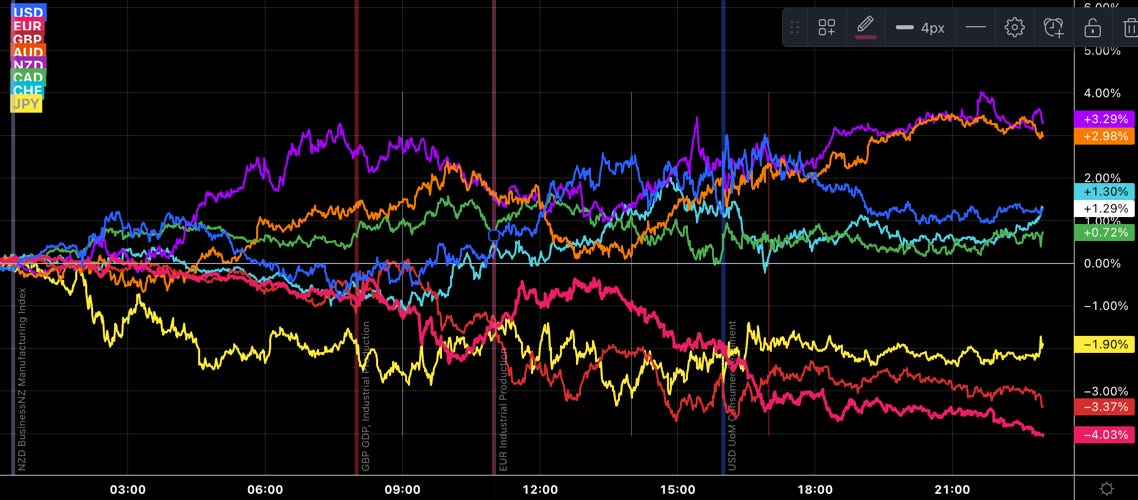
Currency strength over one month: AUD and NZD outperforming, USD and CAD lagging.

Equity sector performance:
Oil/Gas, Metals, Semiconductors, Consumer Discretionary are leading this rally
Healthcare, Staples, Value and Utilities are barely above zero
Overall: this is still very offensive and it doesn’t show signs of slowing down so far

We haven’t seen that much green on sector performance since the start of this newsletter:

Sector charts have improved as well:

International stock markets are diverging pretty significantly over three months:
US indexes in the lead
Nikkei and Topix are up as well
Taiwanese TW50, Kospi and Hang Seng are lagging
SMI and DAX aren’t rallying either

BNY Mellon iFlow shows flows into USD and AUD:

Sentiment and Positioning
The AAII Bull-Bear spread is continuing to relax. It sits now around the low end of its “normal” range:

The TD Ameritrade Investor Movement Index (IMX) is headed lower and sits at a level where the market has bounced in the past. Data is from July:

TD Ameritrade clients reduced exposure in July (…). Despite the reduced exposure, TD Ameritrade clients were actually net buyers of equities overall in July. The sector mix showed buying interest in seven S&P sectors; buying was strongest in Communication Services, Energy, and Materials. TD Ameritrade clients were net sellers in the Consumer Discretionary, Financials, Information Technology, and Utilities sectors.
TD Ameritrade clients were net buyers of a number of individual names during the July period, including Nvidia (NVDA) and Advanced Micro Devices (AMD) (…). TD Ameritrade clients were net buyers [of Intel (INTC)] once again despite this downward pressure on the shares. TD Ameritrade clients were also net buyers of Amazon (AMZN) for the second consecutive period, as the company saw increased interest and activity after splitting its stock for the first time since 1999 in early June. Shopify (SHOP) plunged on reports that it would be laying off 10% of its workforce. Nevertheless, TD Ameritrade clients were net buyers of the battered internet services company.
Other popular names that clients bought included Alphabet (GOOG)/(GOOGL), Ford (F), Carnival (CCL), Disney (DIS), and Meta (META).
On the flip side, TD Ameritrade clients were net sellers of other individual names. Tesla (TSLA) rallied over 20% during the period, and TD Ameritrade clients saw this as an opportunity to reduce exposure in the popular electric vehicle maker. TD Ameritrade clients were also once again net sellers of Chinese electric vehicle maker, Nio (NIO), as the stock struggled over the period. TD Ameritrade clients were also net sellers of Twitter (TWTR), as the stock rallied despite uncertainty surrounding the potential purchase of the company by Elon Musk. In addition, TD Ameritrade clients were again net sellers of Exxon Mobil (XOM), as the stock surged over 10% during the period despite a plunge in oil prices. Netflix (NFLX) rallied after its earnings report that was better than street estimates; TD Ameritrade clients used that as an opportunity to reduce exposure and were net sellers of the struggling streaming giant.
Additional names sold included Moderna (MRNA), Roblox (RBLX), AMC Entertainment (AMC), Pfizer (PFE), Alibaba (BABA).
Macro sentiment on Twitter is still headed lower:

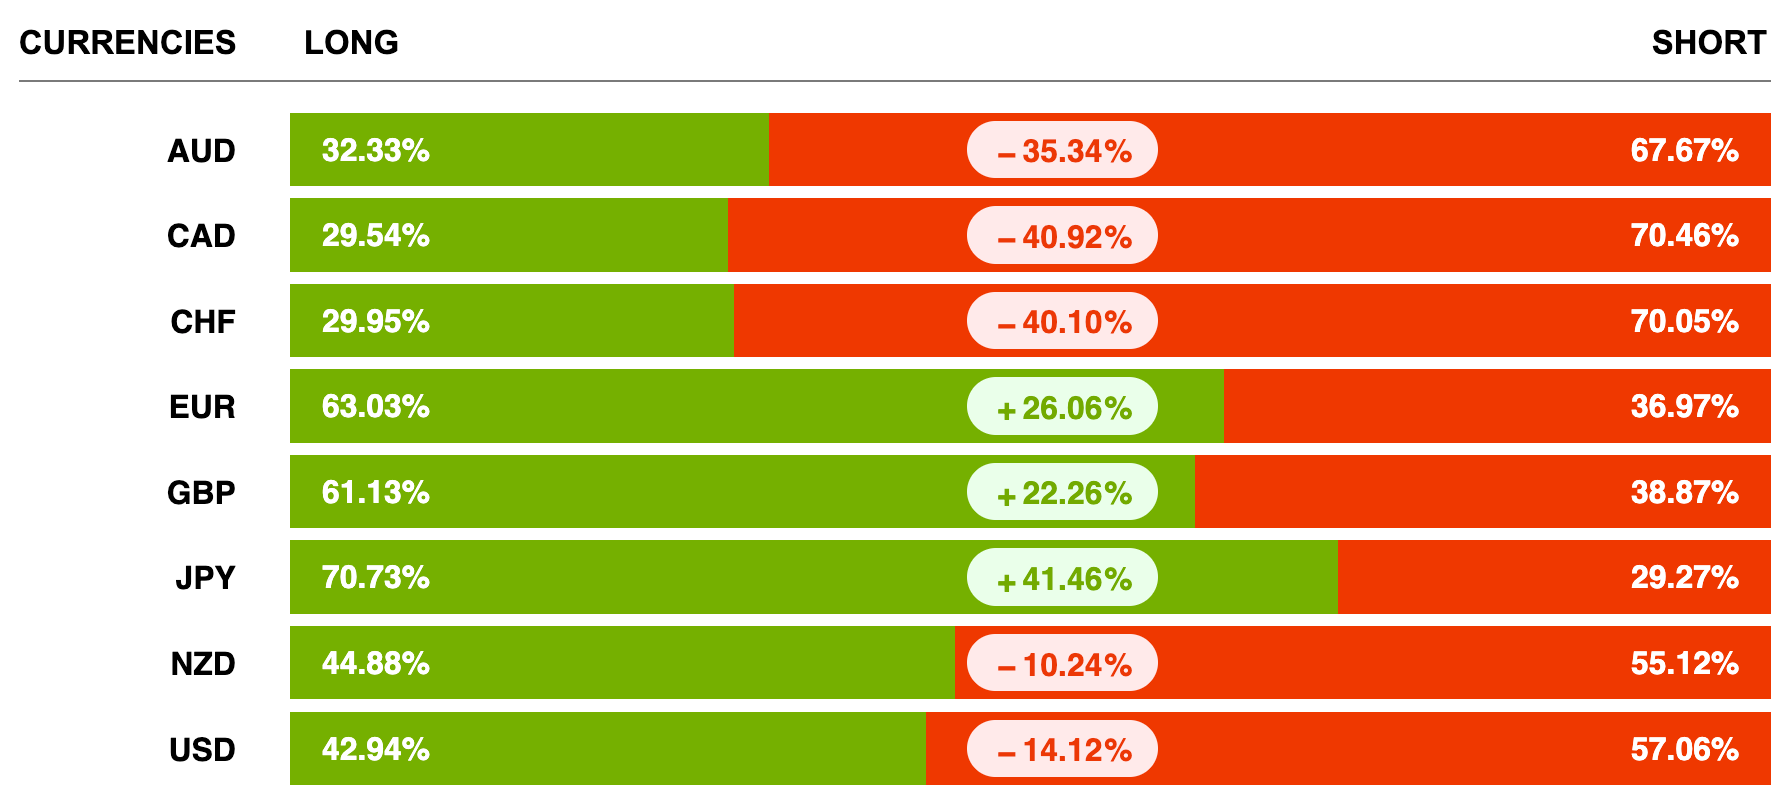
Currency sentiment:
Bullish sentiment for JPY, EUR and GBP
Bearish sentiment for CAD, CHF and AUD
Different sentiment source:
EURCHF and USDCHF both have very bullish sentiment (i.e. long CHF)
USDCAD is also very bullish USD (i.e. long CAD)
Every JPY pair is bullish JPY

Futures performance and Commitment of Traders:
Equity index performance turned green mostly, and all of them are all above their 26-week moving averages (Levy Relative Strength >1).
Commercial and Large Trader positioning in the S&P 500 and the Russell 2k is still very bullish.
Commercial/Large Traders are near extremes in VIX futures positioning.
Bonds are mostly lower with a RSL below 1. Positioning in UB is at a bullish extreme again.
Currencies are mostly weaker except for the Dollar Index. Commercial/Large Trader positioning positioning at a new bearish extreme.
Metals continued their moves higher, but for the most part retain a RSL below 1. Positioning has returned to normal levels except for Copper where Commercials/Large Traders are still near bullish extremes.
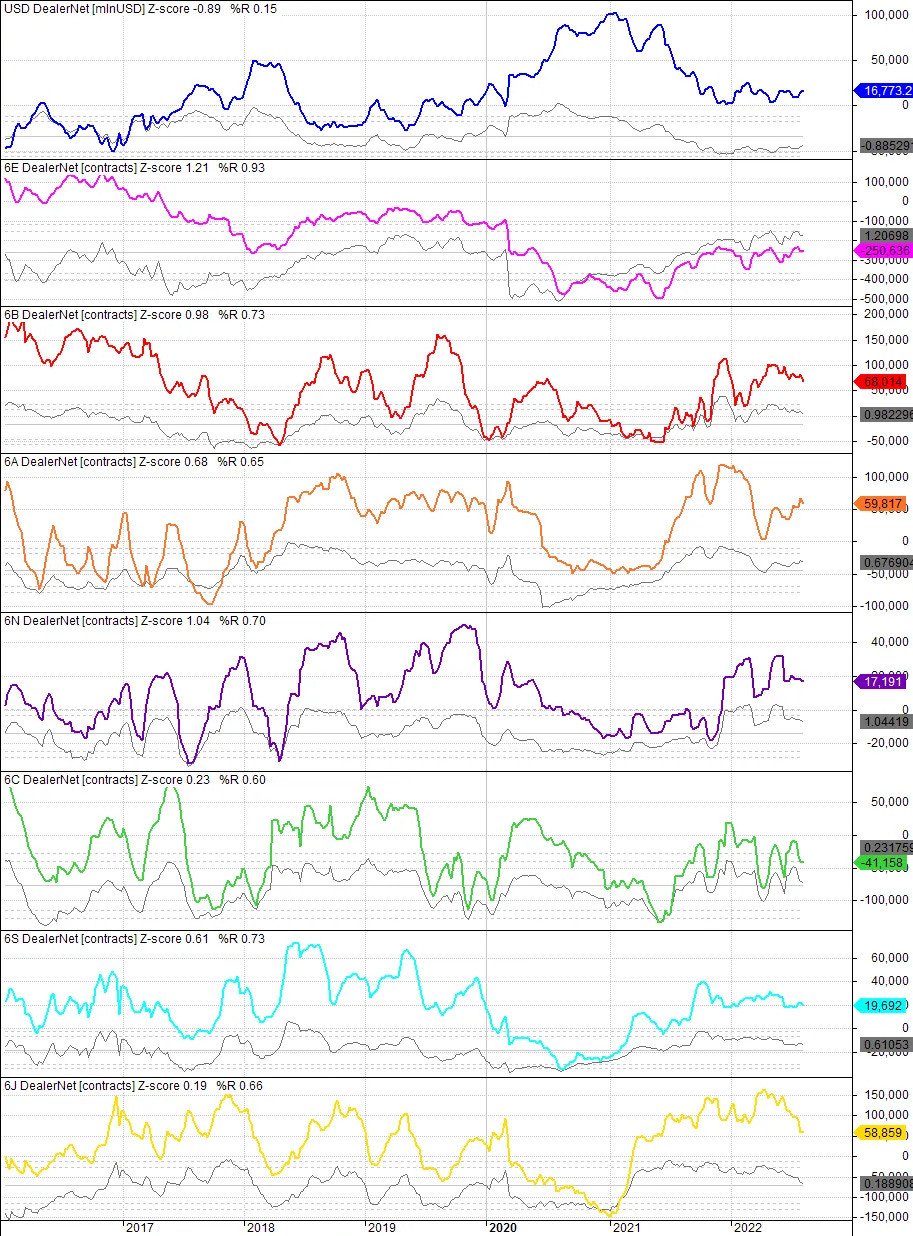
COT/TFF data for currency futures:
Pretty much unchanged from previous weeks
None of the futures is at extreme Dealer positioning levels
6J still has room to move lower
Citi PAIN indexes show that the USD long has suffered a bit while shorts especially in GBP have been covered. Shorts in EUR aren’t budging, though:

Market Risks
High-yield spreads continue to narrow as the market rallies:

Investment grade spreads and the Credit Spread Index remain elevated:


Currency volatilities are all moving lower:

The VIX term structure has pretty much normalized with a contango across the entire curve. VX2 is at a premium of $2.40, which is quite decent:

Different volatility indexes are also quiet: MOVE back below 120, VIX below 20. VVIX isn’t moving lower (put flows into VIX restarting?) and TDEX is also up a bit:

Similar picture in the next chart. I can’t really explain the divergence between VIX/VOLI and SDEX, though. SDEX measures put skew, which is getting flatter. VIX/VOLI measures a combined put and call skew, since VIX includes both puts and calls. By that logic, calls should get be getting more expensive than puts are getting cheaper, which means that the divergence is caused by higher demand for OTM calls. Call buyers are bullish on the current move. (If you have anything to add here, please don’t hesitate to leave a comment!)

The correlation between VIX and VVIX has dipped below 0.20, which has often been a signal for a volatility bounce a few days after it gets above 0.20 again.

Another interesting short-term vol correlation between VIX and the SPX. When it reaches about 0.70, there’s a risk of a move lower in the S&P. (The two instances in the chart aren’t good examples, because they were just one-day spikes.)

The CNN Fear & Greed Index is neutral:


Various
Market breadth continues to go strong. The NYSE Advance/Decline line isn’t stopping:

Index components above their 100-day moving averages have rebounded sharply as well. As I wrote in the last newsletters: this rally has legs to stand on for a while.


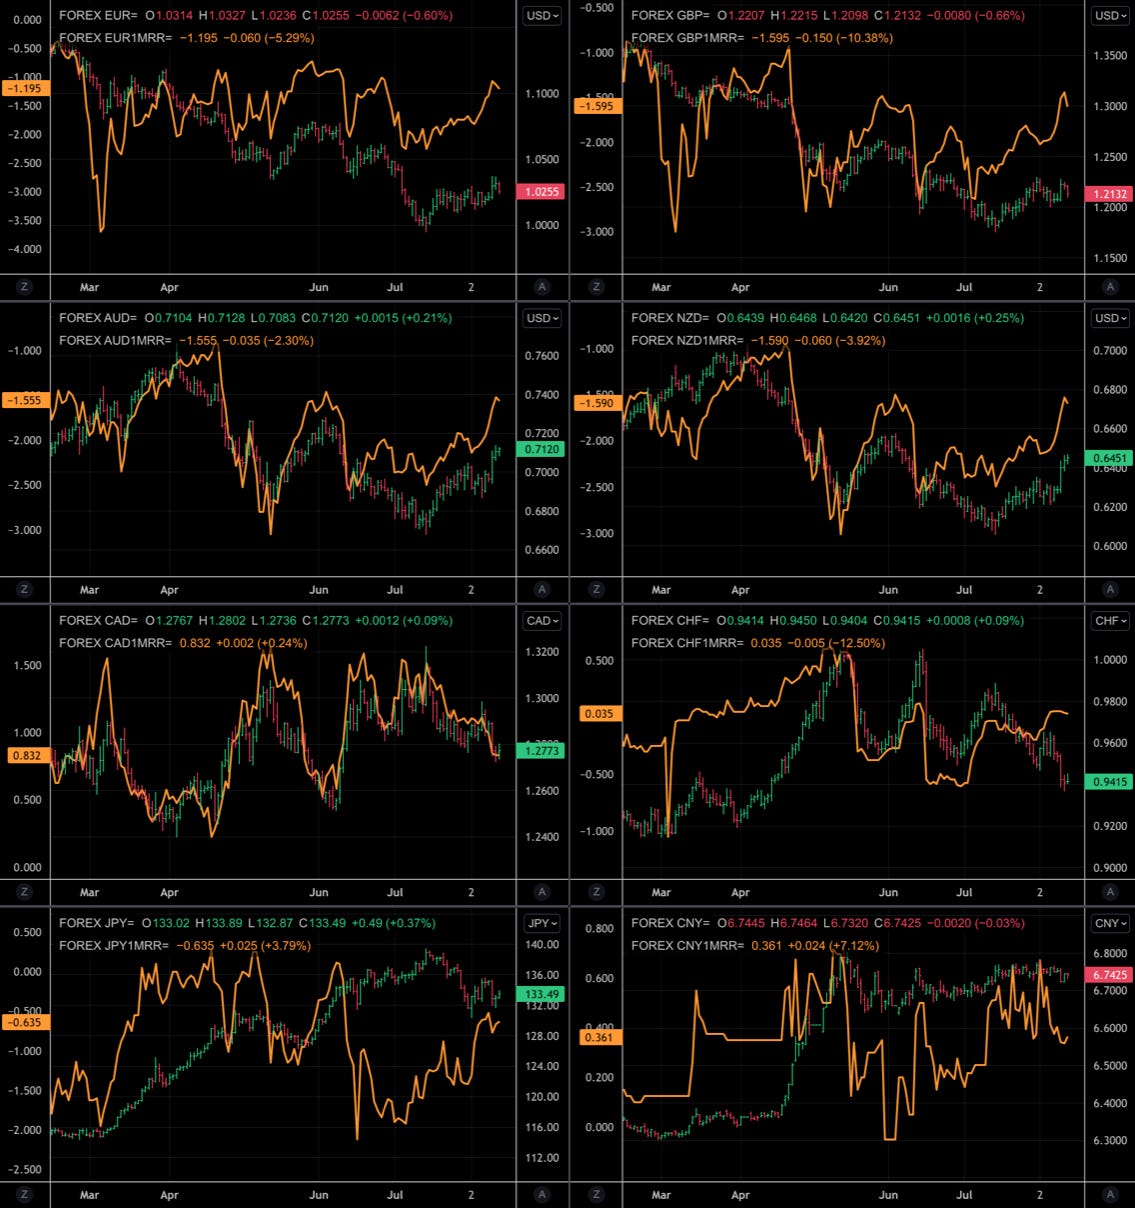
25-delta risk reversals:
EURUSD, GBPUSD are priced higher as is NZDUSD
USDCHF is also seen higher despite price action to the downside
USDJPY is somewhere back to around “neutral”
Other Stuff I've been looking at

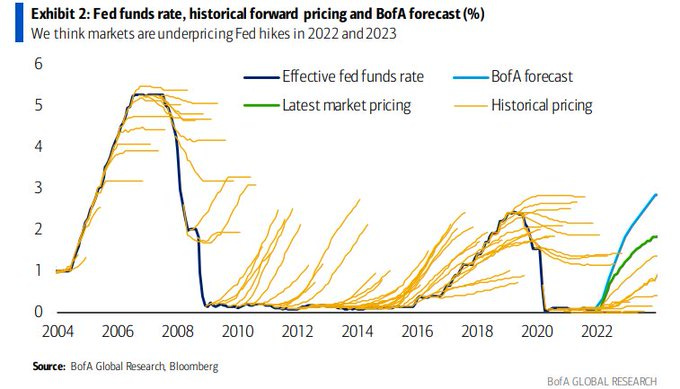
Historical market pricing of Fed policy (it's already a few months old, but worth keeping in mind):
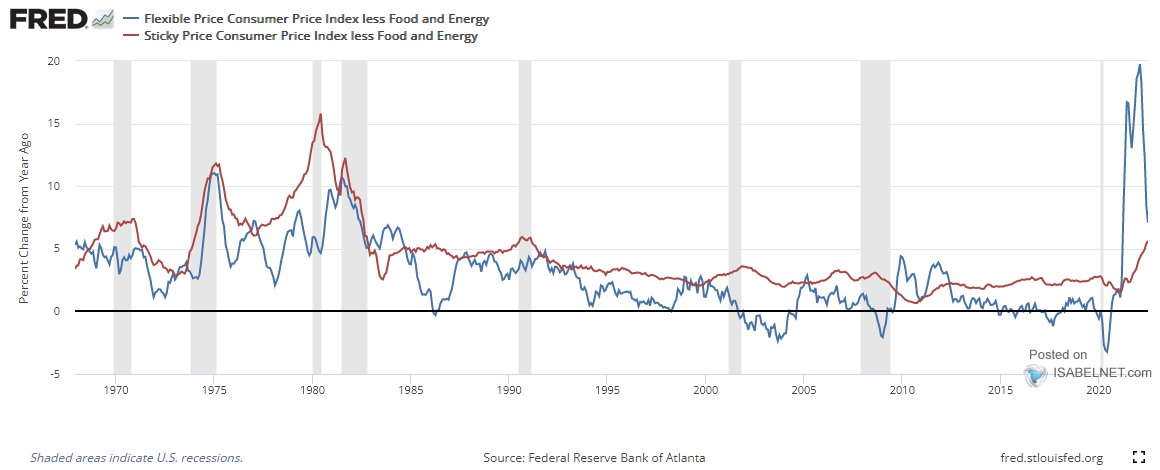
CPI and GDP during the 1970s… blueprint for what's ahead?

Sticky inflation is still increasing:
What the CPI peak might mean for the stock market:

Spiking commodity prices tend to lead to recessions:

Hard and soft data are diverging hard in Europe:

Links to relevant central bank releases in previous editions of this newsletter:
Great as usual
Good round-up, thanks for what you are doing.