Welcome to the second edition of FX & Macro Weekly. Thanks to everyone who subscribed!
This newsletter is quite long, so I've put the most important and boiled-down things first into a Summary section. Everything you find there is derived from data and news I show in detail in the second and third parts of the newsletter (Week in Review and Market Analysis). I encourage you to go through those parts, because they are basically the reasoning behind the conclusions I present in the Summary.
If you like this kind of content, please consider subscribing and sharing it. I'm also on Twitter @fxmacroweekly.
This is the shortest possible summary of everything you will find in the rest of this newsletter.
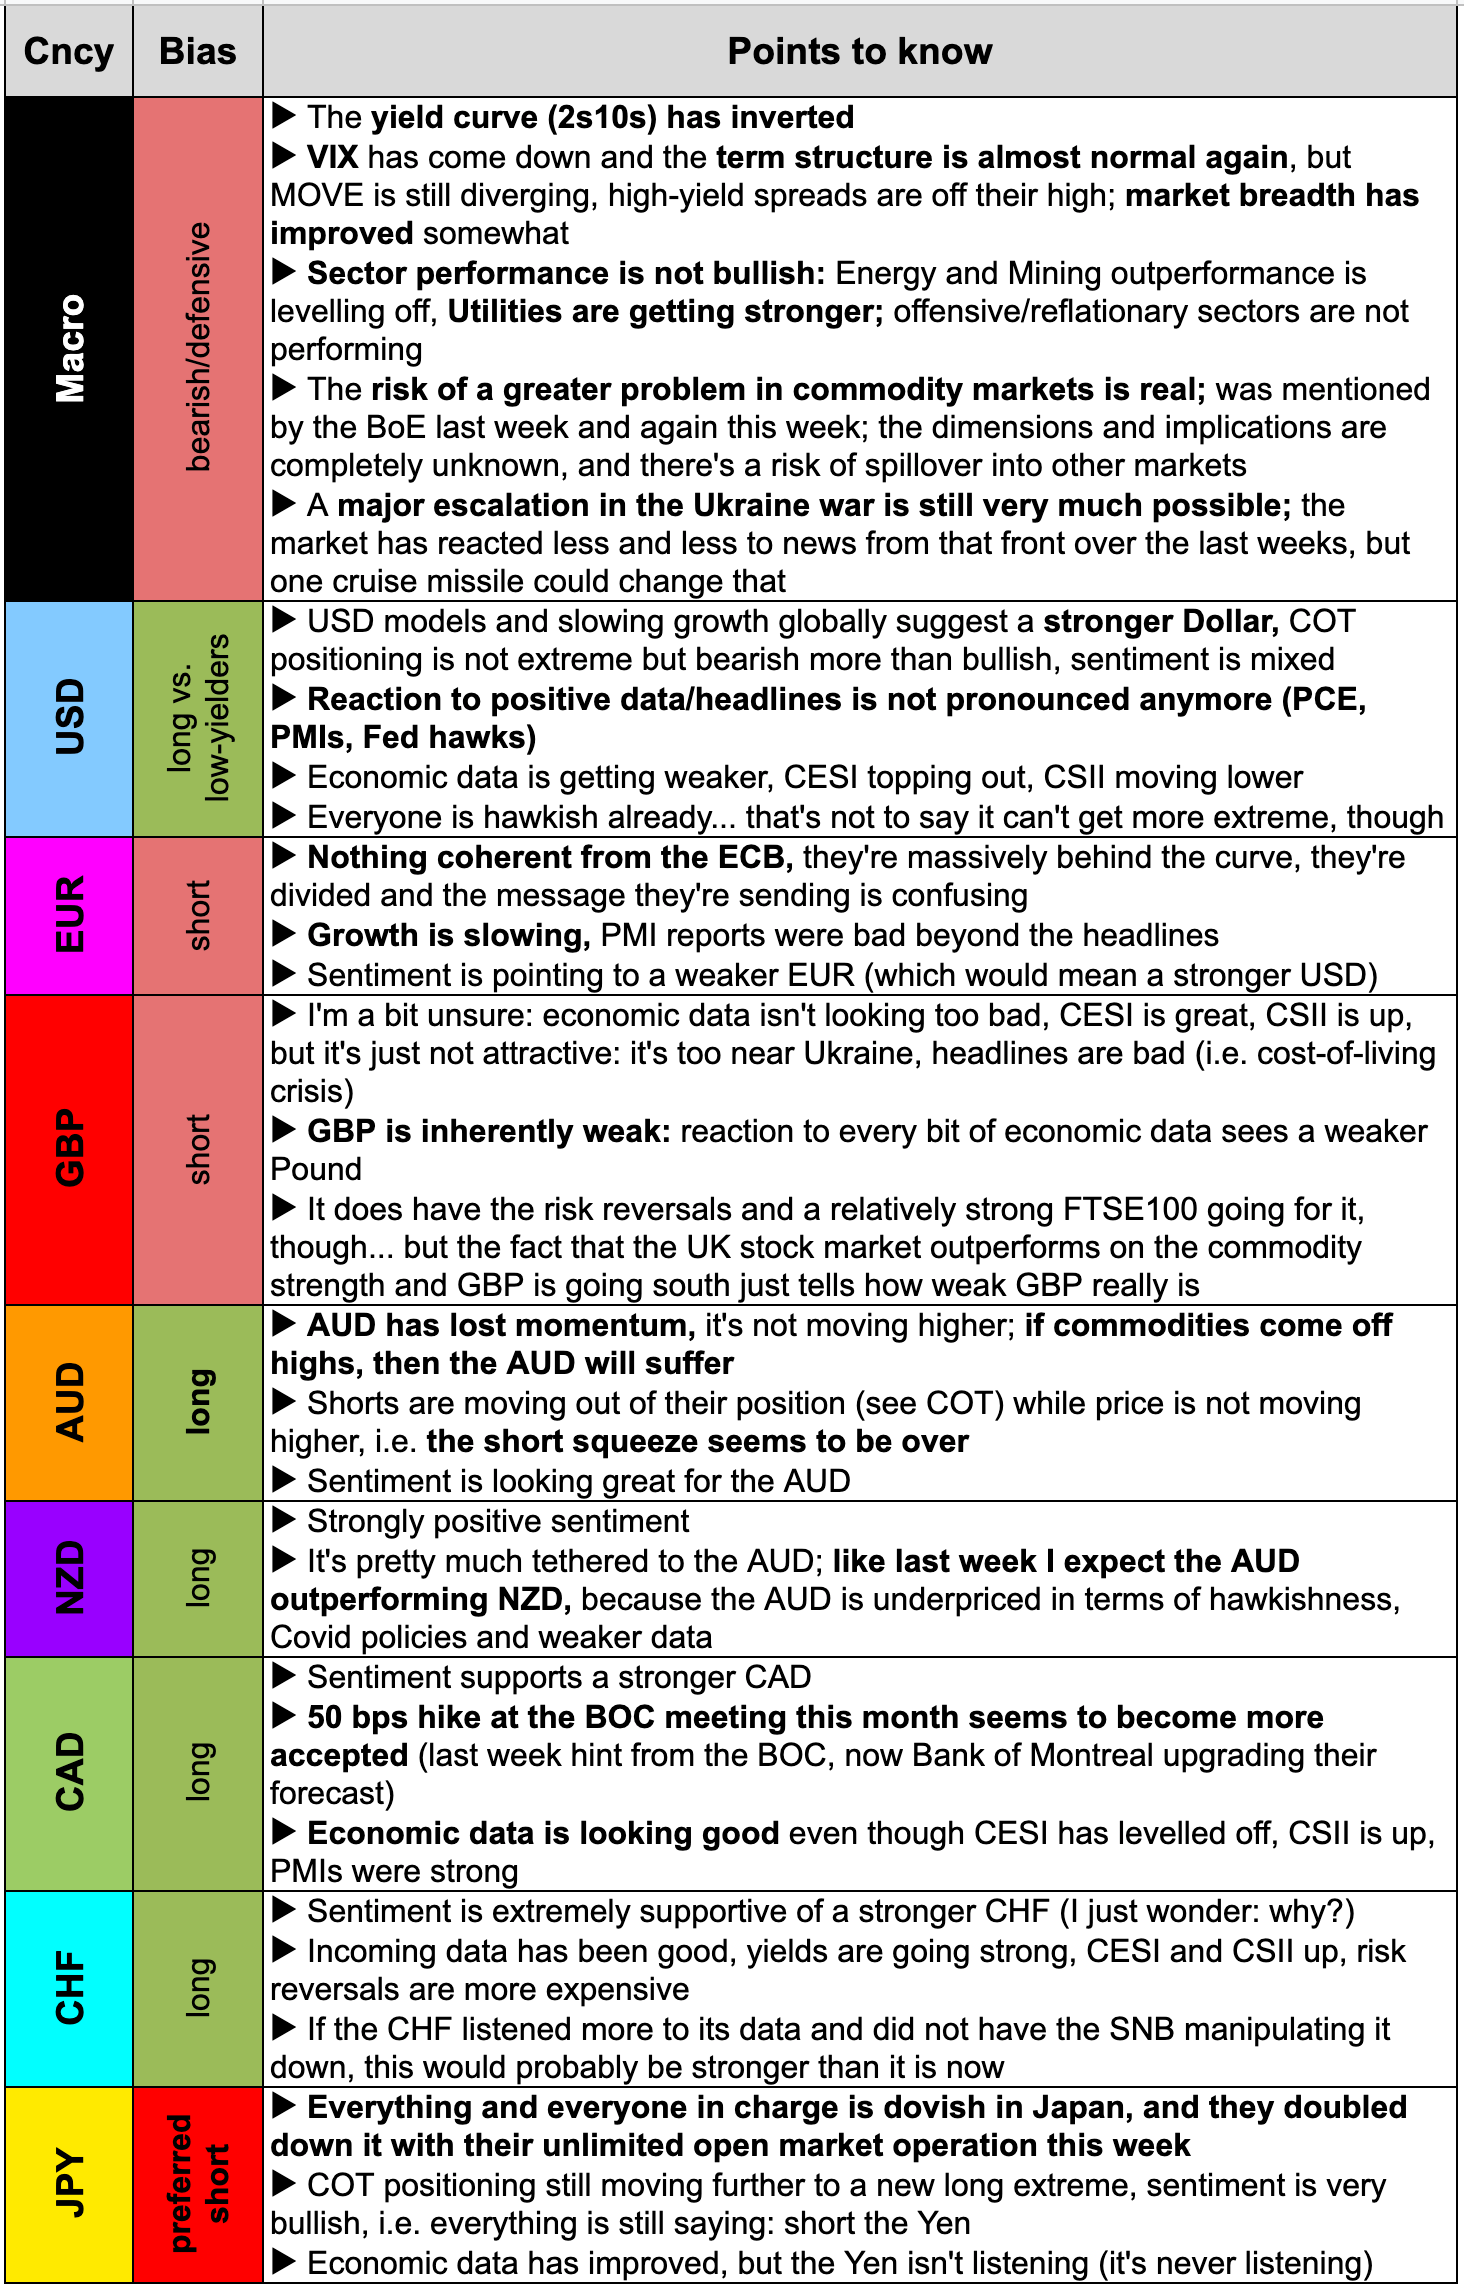
Playbook for next week
So, the overall macro picture is still bearish. Reading the Dollar is more complex than usual because there are a lot of conflicting signals: on the one hand it's not reacting strongly to hawkish Fedspeak or data anymore, because we've already priced in about eight more hikes this year (!!!). On the other hand we're moving into an environment of slowing growth and/or recession that should be very supportive of the Dollar.
One thing that stood out to me this week was how clear sentiment was favouring the AUD, NZD, CAD and CHF.
Economic Calendar for next week
Important levels to watch and look out for in the Majors
Harker (Neutral) expects six more 25 bps hikes this year
supports a 50 bps move next meeting if inflation doesn't ease, neutral rate at 2.5%
not concerned about the yield curve
wants to start balance sheet reduction soon with reduction schedule on auto-pilot, moving out of MBS is consensus at the Fed; debate still ongoing re: passive runoff vs. active selling of holdings
Bostic (Hawk) reiterated his preference for 6 hikes this year
George (Neutral) sees neutral rate at 2.5%, appropriate to raise rates „expeditiously“
balance sheet should be reduced „significantly“
does not look at the yield curve as a recession indicator but inversion has implications for financial stability and should be a factor regarding balance sheet reduction;
a soft landing is possible but not guaranteed
Barkin (Neutral): 50 bps vs. 25 bps hike at next meeting depends on the economy and inflation; does not think high inflation has impacted demand, yet
Evans (Dove) expects 7 hikes this year, 3 hikes next hear, does not see a big risk if rate hike path includes some 50 bps hikes; inflation should come down in H2
JP Morgan: expect to 50 bps hikes in May and June (from 25 bps at each meeting previously), terminal rate just below 3% in 2023
European Central Bank
Lagarde (Dove) saidAPP to be concluded in Q3 if inflation outlook holds up; expects inflation to stop rising; households cutting back on spending with business investment likely to be affected
Holzmann (Hawk) wants interest rate to be at 0% at the end of the year
rates need to be at 1-1.5% eventually
ECB's inflation forecasts already outdated, the ECB may still be underestimating inflation
Lane (Dove) said inflation in the Eurozone will fade because it's a supply shock
Kazimir (Neutral) said first hike could come towards the end of the year unless Ukraine war escalates “dramatically”
Makhlouf (Neutral-dovish): governing council will take whatever action is needed to ensure price stability
Knot (Hawk) sees a “slowflation” rather than a recession
rate hike possible from September
QE to unwind in early Q3 rather than later
HSBC expects the ECB to end all asset purchases in July, 25 bps hike in October, another 25 bps hike in March (2024)
Bank of England
Bailey: evidence of growth slowing; more inflation to come; commodity markets are functioning, but margins have increased and liquidity has deteriorated
BNZ forecasts a series of consecutive 25 bps hikes to a peak of 2.75% in February 2023 (market is currently pricing about 75% for 50 bps at the next meeting)
Bank of Canada
Bank of Montreal: sees two 50 bps hikes in April and June
Bank of Japan
Kuroda: high commodity prices and rising US interest rates are main factors why the Yen is weak, doesn't think BOJ's market operation is affecting FX moves (!)
Amamiya: CPI might reach 2%, but will remain subdued due to lack of wage pressure and weak GDP growth
Summary of Opinions at the Meeting on 17./18.03.: nothing new, inflation to accelerate temporarily due to commodities, unlikely to be sticky, everything was framed in a dovish way
I spare you the details of the unlimited open market operation this week
JPY was extremely weak on the BOJ frantically defending their YCC targets
The Pound was weaker after/during Bailey's speech
G8 currency strength, 28.03.22
Tuesday, 29.03.22
Japanese Unemployment data better than expected, Yen stronger
Aussie Retail Sales above the forecasting range, AUD stronger on the data
German Consumer Climate missed consensus, EUR unchanged
US Job Openings and Consumer Confidence both above expectations, USD saw some strength after that
G8 currency strength, 29.03.22
Wednesday, 30.03.22
ANZ Business Confidence headline number improved slightly, but the report itself was less than stellar: activity outlook was flat, profit expectations hardly changed (as their commentary put it: "still dreadful"), pricing intentions, cost and inflation expectations up. NZD broadly unchanged.
Swiss KOF Economic Barometer declined more than expected. Not much immediate reaction from CHF.
German CPI surprised to the upside but did not exceed the forecasting ranges for y/y and m/m numbers. EUR was immediately weaker, then strengthened a bit; overall not too much directional impact considering the headlines this number generated.
US ADP Non-Farm Employment Change was broadly in line with expectations. The USD was weaker after the release, but did not generate any lasting move.
G8 currency strength, 30.03.22
Thursday, 31.03.22
Industrial Output in Japan declined more than expected, the Yen was initially weaker.
Australian Building Approvals beat expectations, the AUD did not react too much
Chinese Manufacturing and Services PMIs were both weaker and are now both in contraction territory.
Eurozone Retail Sales and Unemployment both came in weaker than forecast. The EUR sold off on both data points and was weaker throughout the day
Core PCE in the US was in line with the m/m forecast, but the y/y measure exceeded the high of the forecasting range. The Dollar was relatively unimpressed, though, so it might be another hint that we've seen "peak hawkishness" priced into the USD already.
The AIG Manufacturing Index in Australia beat expectations, the AUD was stronger on the headline.
G8 currency strength, 31.03.22
Friday, 01.04.22
Japanese PMIs came in better than expected with the Services number above the range of forecasts. The Yen was minimally stronger into the release, but sold off afterwards.
Swiss CPI was in line with expectations and the Manufacturing PMI beat the consensus estimate, but the CHF did not benefit.
HICP in the Eurozone came in above the forecast, and while it is a staggering number it was still within the range of forecasts. The EUR was already weak throughout the day and even sold off after the release. Energy made up over 44% of the entire inflation number (see chart below). Notably, the Eurozone Manufacturing PMI was revised down today by 0.5 points (not shown).
Composition of the Eurozone annual inflation; source: Eurostat
Average Hourly Earnings were unchanged in the US, Non-Farm Payrolls were weaker than expected and the Manufacturing PMI was well below the low of estimates. Inventories are growing and New Orders are declining, especially in the Energy sector, which is probably the first sign of demand destruction due to inflation. The Dollar saw strength after the headlines. Here are some interesting observations from the ISM report (emphasis mine):
While the New Orders Index remains in growth territory, the month-over-month decrease is the largest since a 15.3-percentage point drop in April 2020.
The only industry reporting a decline in new orders in March is Petroleum & Coal Products.
The ISM® Prices Index registered 87.1 percent, up 11.5 percentage points compared to the February reading of 75.6 percent, indicating raw materials prices increased for the 22nd consecutive month, at a notably faster rate in March. This is the biggest month-over-month increase since a 12.2-percentage point gain (to 77.6 percent) in December 2020.
Canadian Manufacturing PMI came in at 58.9 (above the previous 56.6)
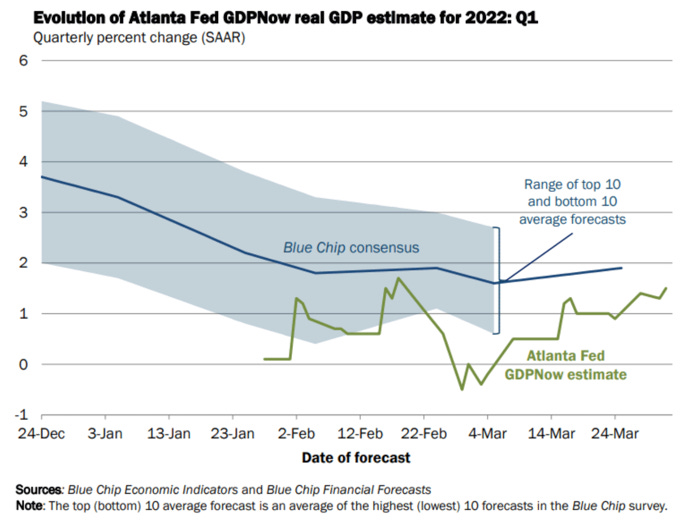
Atlanta Fed GDPNow has improved a bit and now stands at 1.5% for Q1.
Source: Atlanta Fed
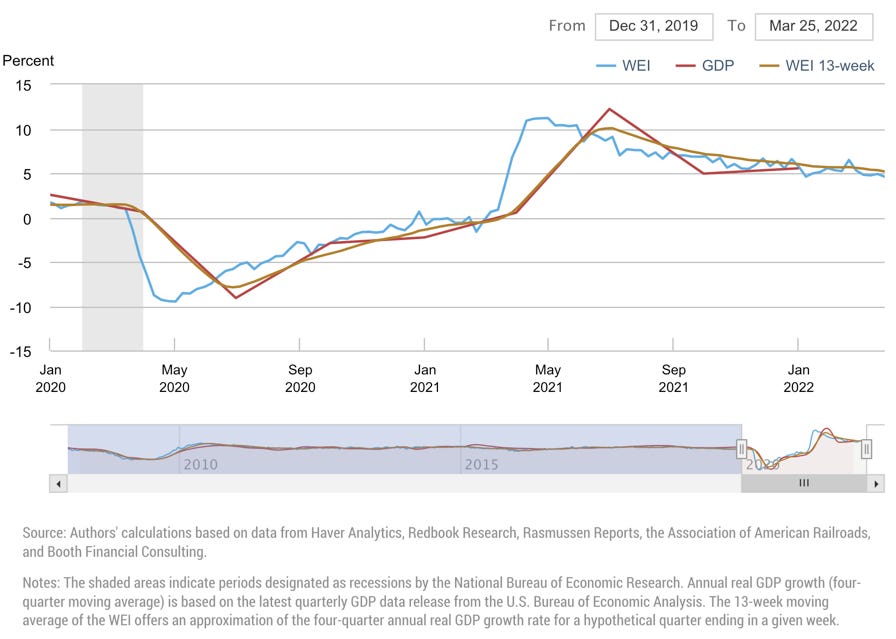
The NY Fed Weekly Economic Index measures four-quarter GDP growth and now sits at 4.60.
Source: NY Fed
Citi Economic Surprise Indexes for the G8 currencies show:
USD might be rolling over,
EUR weakening slightly while GBP is (surprisingly) still going strong
NZD is anemic, AUD did move up a bit, but it's not doing much overall
CHF is the outperformer, CAD is still up after an exceptional labour market report a few weeks back
Citi Economic Surprise Indexes for the G8; source: Refinitiv
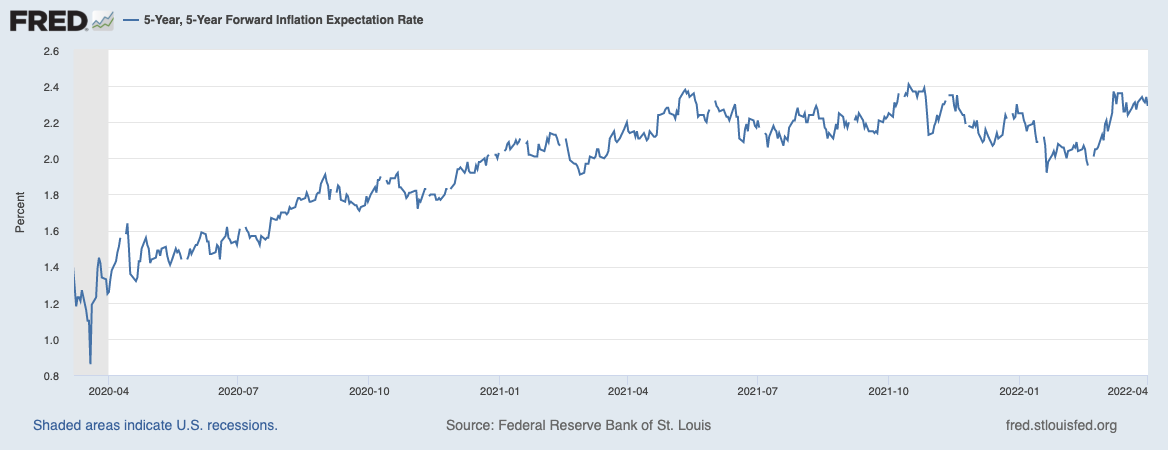
5y5y Forward Inflation Expecations are stuck below 2.4%. The market does expect inflation will come down. Note that this rate has been above 3% in the early 2010s, so it's not particularly high in absolute terms right now.
The inflations expectations ETF RINF is not moving higher, either.
Inflations Expectations ETF
Citi Inflation Surprise Indexes for the G8: the worst in terms of inflation surprises seems to be behind us for the USD while EUR and CHF inflation expectations are still being outgunned by reality to a staggering extent. AUD and NZD are weakening while the GBP is (again a bit surprisingly) flat.
Citi Inflation Surprise Indexes for the G8; source: Refinitiv
PMIs have been relatively innocent in terms of headline numbers in the Eurozone and the UK last week, but it's looking pretty bleak under the hood (several of the EU PMIs have already been revised lower for the final figure). The Swiss PMI was above expectations this week. US PMIs were mixed but solidly in growth territory. China is now in contraction territory with PMIs below 50, and most of Asia is not showing any growth dynamic.
UK 2s and 10s have levelled off and are virtually flat
Swiss yields have been strong along with German/European yields
Japanese 10s back below 25 bps
Note: most of the 10s are at or near longer-term resistance areas, so they could come off highs or move sideways for a while.
G8+CNY 10y and 2y yield
G20 10y yield and change; source: tradingeconomics.com
The 2s10s of the US yield curve inverted last week and they now sit at -7.6 bps. The German yield curve had been an outlier for a while (probably because the long end has been pricing in inflation while the short end was pricing a too-dovish ECB). It's too early to tell if it has rolled over especially in light of quarter-end rebalancing that has been going on last week. To put yield curve inversions in markets outside the US in perspective, here's what Joesph Politano at Apricitas Economics wrote last last week:
(…) the yield curve has a worse predictive track record outside the US, failing to predict any Italian recessions while littering Canada and the UK with false positives.
G8 2s10s
Central Banks
The two tables below show current target rate probabilities for the FOMC meetings. In case you're wondering why they look different somehow: that's because the market is now pricing a non-zero chance of a Fed Funds Rate of 450-475 bps in July 2023 (!!!) instead of just 375-400 bps last week. And that's how things are going. We're now pricing two 50 bps hikes this year (instead of just one last week), the FFR is expected to be at 250-275 bps by December (last week: 225-250).
FOMC target rate probabilities, current week; source: CME
The following chart shows the dramatic repricing that has been going on recently. Fed Funds Futures imply 8 hikes until December, about 3 hikes next year and an easing of about 1% in 2024. And all of it has become more pronounced over the last week.
There were two major moves in the JPY (BOJ defending the 25 bps cap on 10s) and the EUR (positive headlines from the Ukraine war) this week on Monday and Tuesday, respectively. The EUR and Swissie were the strongest currencies of the week, the GBP once again the weakest.
Relative strength of G8 currencies over the last week
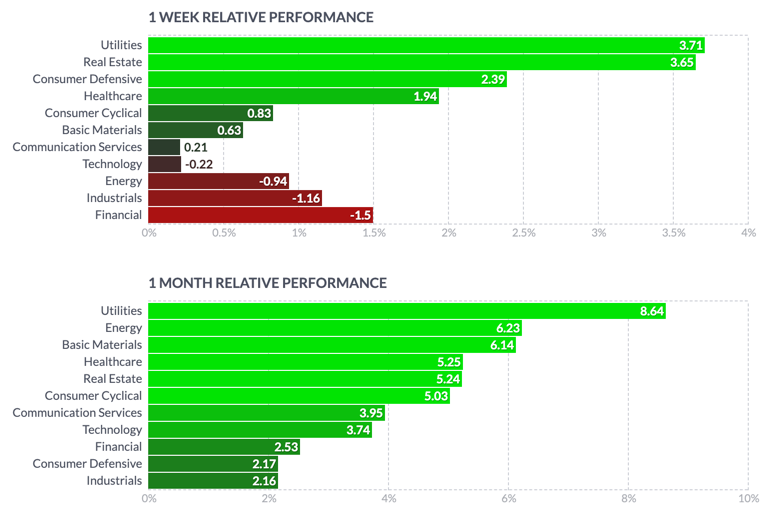
The S&P 500 has staged an impressive rally over the last two weeks, but it's all been about defensive sectors (and Energy). This is not a reflationary rally at all.
As mentioned last week: Utilities (XLU) are starting to perform while Energy (OIH, XOP, XLE) and Mining (XME) are levelling off. Sectors are not believing that this is still a bull market.
Relative sector performances, 3 months
The rally in commodities is still benefiting the Brazilian (IBOV), Canadian (TSX) and UK (UK100) markets. Everyone else is in the red. German DAX and the EuroStoxx (SX5E) are at the bottom.
Relative international stock market performance, 3 months
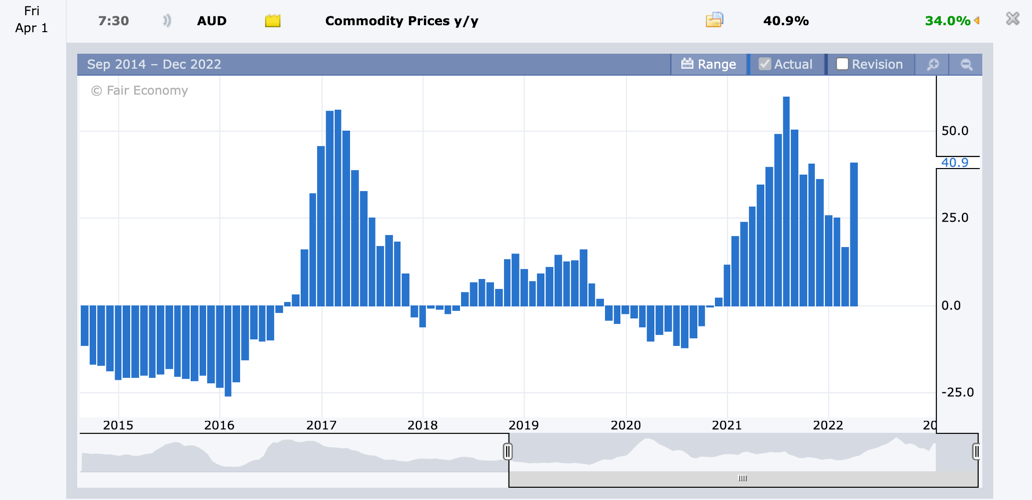
Commodity Prices in Australia are up 40% y/y. That's what keeps it going, and that's what makes it vulnerable.
Australian Commodity Prices; source:forexfactory.com
Sentiment is 75% positive for the JPY, which strengthens the bear case and fits nicely with positioning seen in the Commitment of Traders data (below). Currencies with the worst sentiment are AUD, CAD, CHF and NZD. That's a contrarian's dream.
G8 currencies sentiment; source: Dukascopy
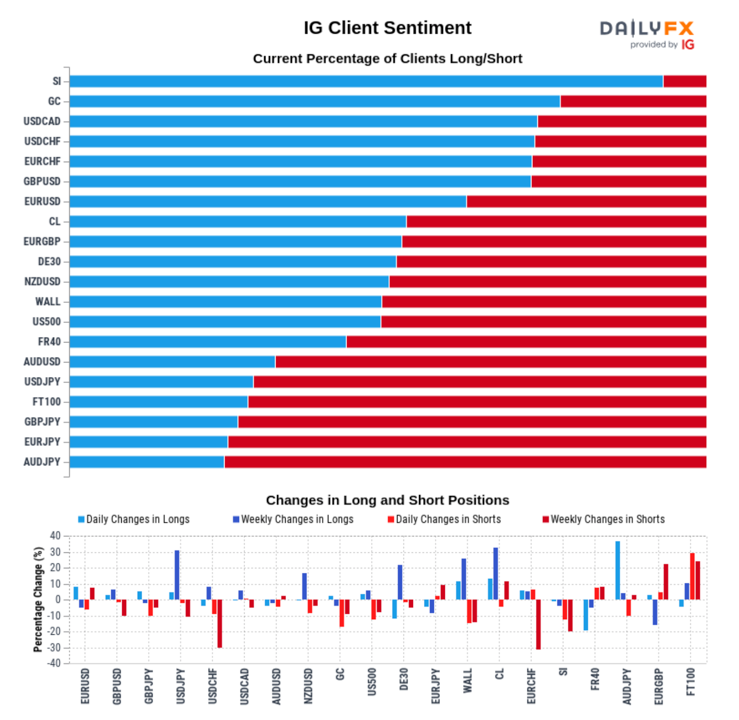
Another look at sentiment in the chart below that largely confirms what we've seen before. Sentiment is currently
bearish for CAD (i.e. bullish for USDCAD),
bearish for AUD (i.e. AUDJPY and AUDUSD)
bearish for CHF (i.e. bullish USDCHF, EURCHF)
bearish for JPY (i.e. bullish USDHJPY and all other JPY pairs)
It's really a surprisingly clear picture. And interestingly, Silver (SI) is as bullish as it can get while Gold (GC) is not far behind. The bearish positioning in the FT100 is interesting given that it's one of the very few indexes that held up during the recent market selloff (see above), and it should support it further.
Positioning in various instruments; source: dailyfx.com
Commitment of Traders shows an increase in Dealer Net positioning in 6J over the previous week to a >5-year-high, i.e. the street is now even shorter JPY. As I've written before: this will be an epic short squeeze for the JPY in the future. The dealers were able to reduce their long position with the AUD moving more or less sideways, which means that everybody else has been buying from them near the current high. Dollar positioning is still supportive of a weaker USD.
The downward move in the VIX over the last two weeks was remarkable. The behaviour of VIX and MOVE is still divergent, so I'm regarding it as a warning sign for now.
VIX and MOVE
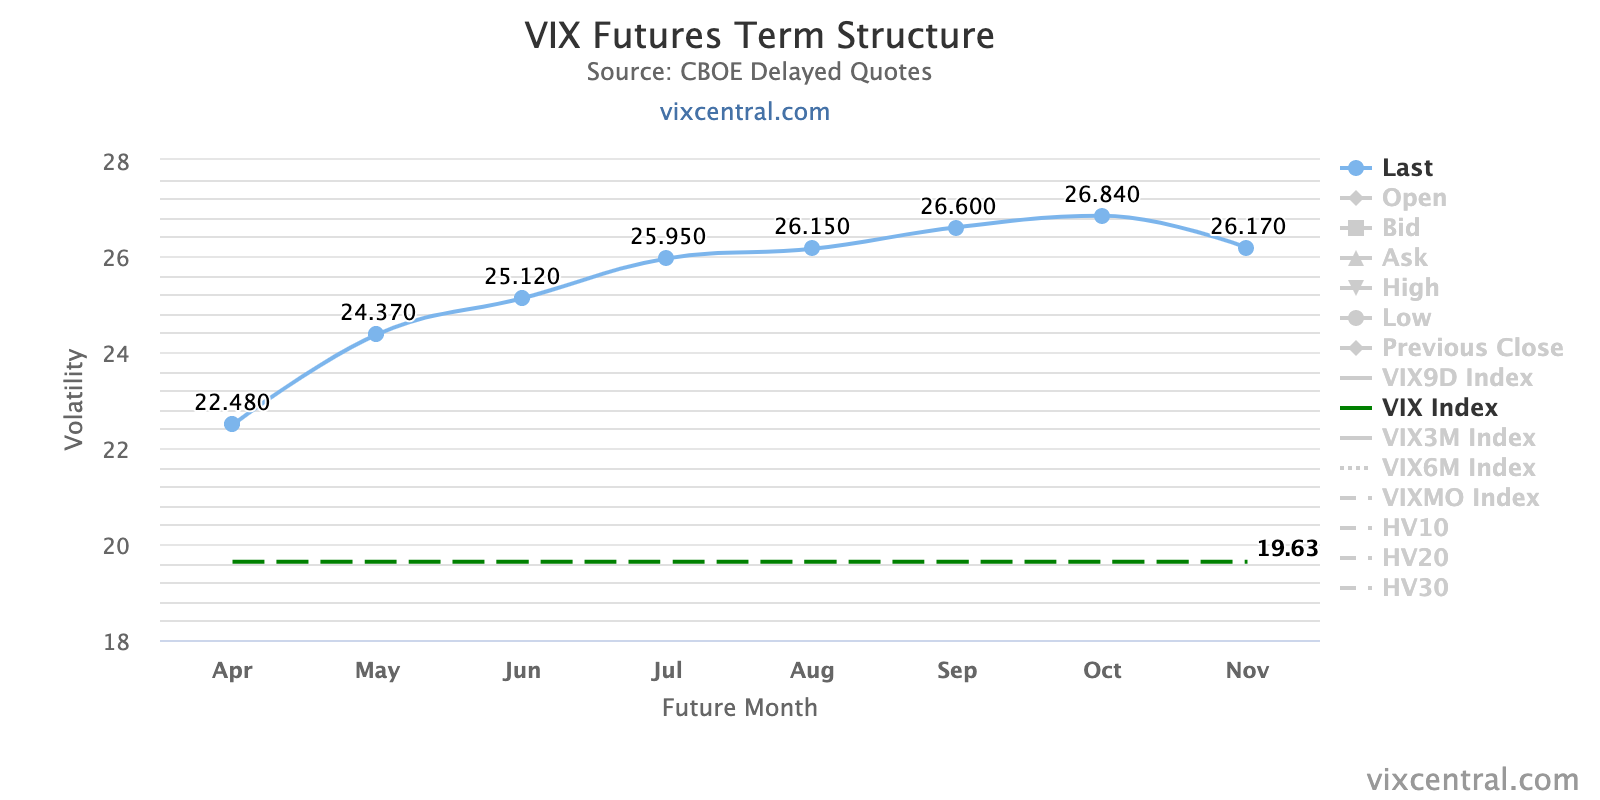
The VIX term structure has normalized further, premium of VIX cash to VX1 is almost $3, and the contango between VX1 and VX2 is almost $2, so this looks pretty calm.
High-yield spreads have moved down significantly from their recent peak, which is a sign of markets calming down. HYOAS now sit at 3.43%.
Various
Seasonality is unchanged from last week (and will be so for the next couple of weeks…).
Risk Reversals are pricing the GBP and CHF higher (CNY as well).
Congrats, you've made it through the whole thing 🙂 I hope you've found it useful. Please reach out to me if you have questions or suggestions. And if you like this content, please consider subscribing and/or sharing it with others!